The differences between the two are as follows:
Table Of Contents
What Is The Coefficient Of Skewness?
The coefficient of skewness is a statistical measure used to determine the strength and direction of skewness within a dataset. Skewness in a distribution indicates the degree of asymmetry in the probability distribution. This asymmetry can be either positive or negative.
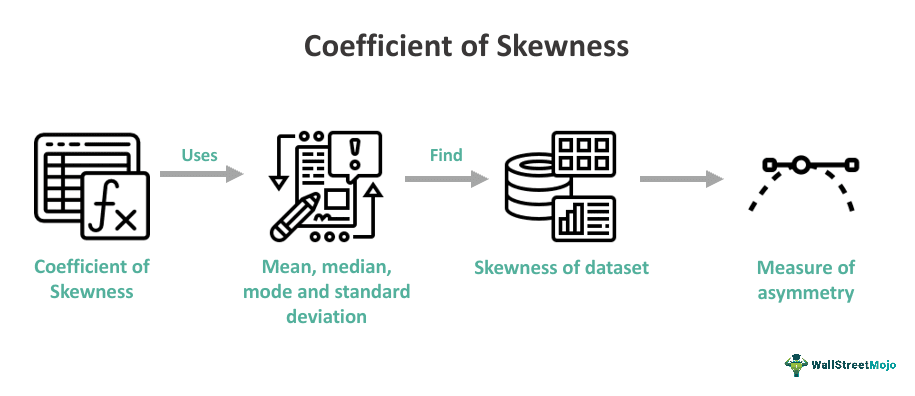
This measure compares the given distribution to a normal distribution using key statistical concepts, such as the mean, median, and mode. In a distribution, the mean typically exhibits a longer tail on the same side as the mode. A higher value of the coefficient suggests a more significant difference between the given distribution and a normal distribution.
Key Takeaways
- The coefficient of skewness is a statistical measure to assess the shape of a data distribution and helps determine whether the data is symmetric or skewed.
- It's based on the concepts of mean, mode, and median. Also, it is a dimensionless number, making it independent of measurement units, and it provides a relative measure of skewness.
- Symmetry in a distribution means it's close to the center point, while negative skewness indicates that the data distribution extends more to the left. Positive skewness suggests that it extends more to the right.
Coefficient Of Skewness Explained
The coefficient of skewness is a statistical measure that reveals the asymmetry in a given frequency distribution. In other words, it measures the distribution's skewness. It uses mean, mode, and median concepts for the same. It is a pure number independent of the measurement units and calculates the relative measures. Relative measures compare two or more series for variability.
If the mean exceeds the other two (median and mode), the given distribution matches a positively skewed distribution. In other words, when the distribution is skewed to the right, it is positive and has a longer tail. In a positively skewed distribution, the mean value is the maximum, the mode's value is the least, and the median lies between both. The frequencies here are spread over a larger range of values on the right side of the center point more than on the left.
If the mode value exceeds the other two (the mean and median), then it is negative. It means the negatively skewed distribution and will show distribution to the left. In a negatively skewed scenario, the mode value is at maximum, and the least value would be that of the mean. The median value will lie between both of these values. Here, the frequencies are spread over a larger range of values on the left side of the center than on its right side.
Similarly, if the mean, mode, and median are all equal, it is most probably a normal distribution. The coefficient of skewness will be zero here. The median, mean, and mode values coincide, and the frequencies spread are the same on both sides of the Centrepoint.
Formula
There are multiple ways to calculate the coefficient of skewness. They include Karl Pearson's Coefficient of Skewness, Bowleys's Coefficient of Skewness and Kelly's Coefficient of Skewness (based on percentiles and deciles. However, the most popular is Karl Pearson's coefficient of skewness. The formula for the same is:
Karl Pearson Coefficient of Skewness formula:
Sk = 3(mean - median) / Standard Deviation.
One can also use a coefficient of skewness calculator to calculate it.
Examples
Let us look into a few examples to understand the concept better.
Example #1
Let us calculate Pearson's Coefficient of Skewness. Suppose a dataset's mean is 59.2, the median value is 56.42, the mode value is 50.88, and the standard deviation is 13. With the above information, we can calculate the coefficient of skewness with the following formula:
Sk = 3(mean - median) / Standard Deviation
=3(59.2-56.42)/13
=3*2.78/13
=0.64
Example #2
Suppose ABC Ltd, a retail company, analyzes daily sales data for a specific product category. To understand the sales distribution, the company collects data from various periods and calculates the mean, median, mode, and coefficient of skewness. The mean is the average sales value, the median is the middle value, and the mode is the particular sales figure that occurs frequently.
Through the data obtained, it was found that the coefficient of skewness is positive. Sales data are right-skewed, as indicated by the positive coefficient of skewness; when making decisions, this data can be utilized to determine outliers, set inventory levels, and modify sales projections. Recognizing skewness in business data enables organizations to consider data asymmetry, account for it, and incorporate it into strategies and risk management techniques.
Importance
The coefficient of skewness is significant since it sheds light on a dataset's symmetry and general structure. It evaluates the type and magnitude of skewness. It is particularly useful in assessing departures from normality, which can impact the validity of statistical tests and forecasts. Skewness is relevant in risk assessment and portfolio management. It can affect decision-making, risk assessment, and modeling assumptions. Therefore, skewness is relevant in several domains, including finance, economics, and the social sciences.
Coefficient Of skewness vs Coefficient Of Kurtosis
| Key points | Coefficient of skewness | Coefficient of kurtosis |
|---|---|---|
| 1. Concept | It measures the skewness of a distribution. It is founded on the idea of the distribution's moment. This coefficient is one of the metrics that reveal the level of skewness. | The peakness or flatness of a curve can be determined using the coefficient of kurtosis. It is based on the distribution's moments. It measures kurtosis. |
| 2. Method of interpretation | The fourth-order moment of the distribution is divided by the population's standard deviation or is raised to the fourth power to produce a coefficient of kurtosis. | Skewness in statistics is a measure of symmetry, specifically the absence of symmetry. It evaluates skewness using mean, mode and median values. They can be measured using techniques such as Person's and Bowley's. |
| 3. Inference | High kurtosis indicates that extreme values are considerably more frequent (compared to a normal distribution with a similar mean and standard deviation) on both the right (positive) and left (negative) tails. The values very near to the mean are often substantially more frequent, whereas the values in the middle (not too near the middle, not too far from the tails) are typically relatively less frequent. | A distribution or data set is called symmetrical if it seems close to the center point. It is negative if it covers more of the graph's left side; it is positive if it covers more of the right side. |
Frequently Asked Questions (FAQs)
1
What is the importance of the coefficient of skewness?
2
What is the first coefficient of skewness?
3
