Table Of Contents
What is the Coefficient of Determination?
The coefficient of determination, also known as R-Squared, determines the extent of the variance of the dependent variable, which the independent variable can explain. Looking at the R^2 value, one can judge whether the regression equation is good enough. The higher the coefficient, the better the regression equation, which implies that the independent variable chosen to determine the dependent variable is chosen properly.

The coefficient of determination calculator (R-squared) is pivotal for investors and analysts. It quantifies the proportion of a dependent variable's variability explained by a regression model. A high R-squared signifies a strong relationship, aiding analysts in assessing the model's reliability. This statistical measure is indispensable for making well-informed financial decisions based on the predictive power of regression models.
Coefficient of Determination Explained
Coefficient of determination, often denoted as R-squared. This statistical tool is instrumental in assessing the goodness of fit of a regression model, shedding light on how well the model explains the variability of the dependent variable.
In simpler terms, the coefficient of determination is a percentage that represents the proportion of the dependent variable's variance that can be predicted from the independent variable(s) in a regression model. In other words, it gauges the strength of the relationship between the variables under consideration. A high R-squared value, close to 1, indicates that a large percentage of the variability in the dependent variable is explained by the independent variable(s). On the contrary, a low R-squared, approaching 0, suggests a weak relationship, implying that the model does not effectively explain the variability observed.
Investors and financial analysts often rely on the coefficient of determination calculator to evaluate the reliability of a regression model when studying the relationship between financial variables. It serves as a valuable tool for assessing the predictive power of the model and aids in distinguishing between robust and weak models. However, it's essential to note that a high R-squared does not imply causation; correlation does not necessarily equal causation.
Formula
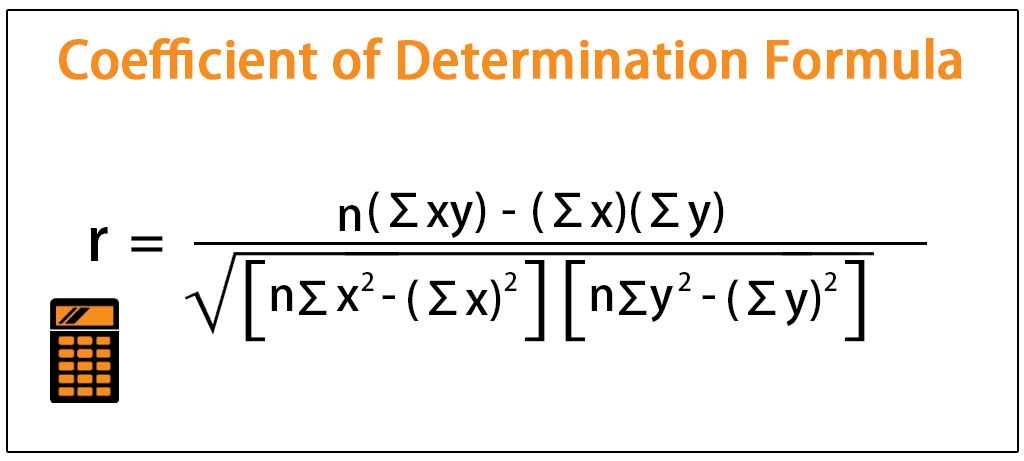
Let us understand the formula that shall act as a basis of our understanding of the concept and the intricacies of coefficient of determination statistics.

Where
- R= Correlation
- R^2= Coefficient of determination of the regression equation
- N= Number of observations in the regression equation
- Xi= Independent variable of the regression equation
- X= Mean of the independent variable of the regression equation
- Yi= Dependent variable of the regression equation
- Y= Mean of the dependent variable of the regression equation
- σx = Standard deviation of the independent variable
- σy = Standard deviation of the dependent variable
The coefficient value ranges from 0 to 1, where a value of 0 indicates that the independent variable does not explain the variation of the dependent variable. Conversely, a value of 1 indicates that the independent variable perfectly explains the variation in the dependent variable.
Examples
Let us try and understand the coefficient of determination formula with the help of a couple of examples.
Example #1
First, let us try to find out the relation between the distance covered by the truck driver and the age of the truck driver. Then, someone does a regression equation to validate whether what he thinks of the relationship between two variables is also validated by the regression equation. In this example, we will see the dependent and independent variables.
The dependent variable in this regression equation is the distance covered by the truck driver, and the independent variable is the age of the truck driver. Therefore, we can find the correlation with the help of the formula and square to get the coefficient of the regression equation. The data set and the variables are presented in the attached Excel sheet.
Solution:
Below is the data for the calculation of the coefficient of determination.

Therefore, the calculation of the coefficient of determination is as follows:

R = -424520/√(683696*81071100)
Hence, R will be -

R = -0.057020839
R^2 will be -

R^2 = 0.325%
Example #2
Let us try and understand the concept of coefficient of determination calculator with the help of another example. Let us try to find out the relation between the height of the students of a class and the GPA grade of those students. In this example, we will see the dependent and independent variables.
The dependent variable in this regression equation is the student's GPA, and the independent variable is the height of the student. We can find the correlation with the help of the formula and square to get the R^2 of the regression equation. The data set and the variables are presented in the Excel sheet attached.
Solution:
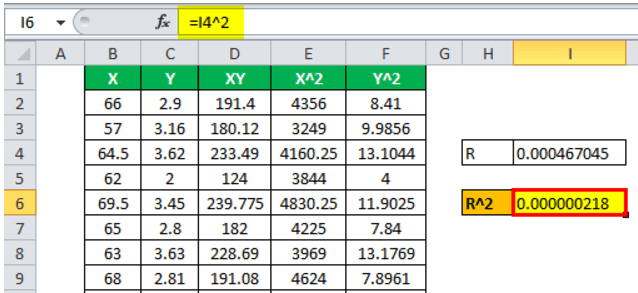
Below is the data for the calculation of the coefficient of determination.

Therefore, the calculation is as follows:

R = 34.62/√(169204*3245)

R = 0.000467045

R^2 = 0.000000218
Interpretation
The coefficient of determination is a critical output to determine whether the data set is a good fit. Someone does a regression analysis to validate whether what he thinks of the relationship between two variables is also validated by the regression equation. The higher the coefficient, the better the regression equation, as it implies that the independent variable is chosen to determine the dependent variable chosen properly. Ideally, a researcher will look for the coefficient of determination closest to 100%.
Significance
Let us understand the significance of the coefficient of determination statistics through the points below.
- The coefficient of determination (R-squared) is a crucial statistical metric in financial analysis, providing a quantifiable measure of how well a regression model predicts the variability in a dependent variable.
- A high R-squared, close to 1, indicates a robust relationship between the independent and dependent variables. This implies that a significant percentage of the observed variability in the financial data can be explained by the model, enhancing its credibility.
- Investors and financial analysts heavily rely on R-squared to gauge the reliability of regression models. A high R-squared instills confidence in decision-making processes, allowing stakeholders to trust the predictions derived from the model when making crucial financial decisions.
- While a high R-squared is desirable, it's essential to remember that correlation does not imply causation. Analysts should interpret R-squared values in conjunction with other relevant information to ensure a comprehensive understanding of the financial dynamics at play.
Coefficient of Determination Vs Correlation Coefficient
Let us understand the difference between the two concepts through the comparison below.
Coefficient of Determination
- The coefficient of determination, denoted as R-squared, is a statistical measure that assesses the proportion of the variability in the dependent variable that can be predicted by the independent variable(s) in a regression model.
- R-squared values range from 0 to 1. A value of 1 indicates a perfect fit, signifying that the model explains all the observed variability. Conversely, a value of 0 implies that the model does not explain any variability.
- In financial analysis, a high R-squared is desirable as it suggests that the model can account for a significant percentage of the variability in financial data. It is a crucial tool for evaluating the goodness of fit of regression models, aiding in decision-making processes and model selection.
- R-squared, however, does not imply causation. Even with a high R-squared, the relationship between variables might be coincidental, emphasizing the need for careful interpretation.
Correlation Coefficient
- The correlation coefficient is a statistical measure that quantifies the degree and direction of a linear relationship between two variables. It is denoted by the symbol "r."
- The correlation coefficient ranges from -1 to 1. A value of 1 indicates a perfect positive linear relationship, -1 indicates a perfect negative linear relationship, and 0 indicates no linear relationship.
- In finance, the correlation coefficient helps analysts understand the association between two financial variables. However, unlike R-squared, it does not provide information about causation or the proportion of variance explained.
- Investors and analysts use the correlation coefficient to diversify portfolios by selecting assets with low or negative correlation, aiming to reduce overall risk. It is a valuable tool for understanding the direction and strength of linear associations between financial variables.

