What Is Chaikin Oscillator?
Chaikin Oscillator is a tool frequently used in technical analysis to identify the pressure of buying and selling of securities in the financial market. It is a very versatile tool developed by Marc Chaikin, which investors and traders use to measure momentum.

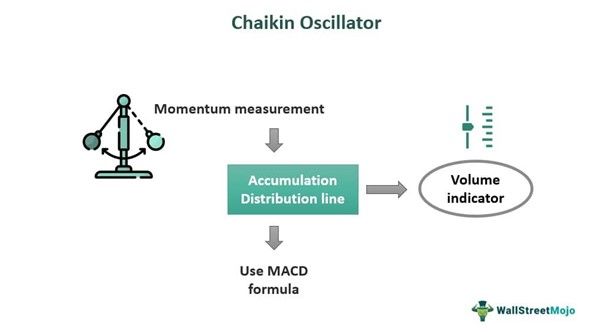
In this tool, the Accumulation Distribution Line (ADL), which is a volume indicator used to measure the money flow in and out of a security, plays an important role. The oscillator estimates the ADL’s momentum using the formula of Moving Average Convergence Divergence (MACD).
- The Chaikin Oscillator is a method of technical analysis of securities that investors and traders widely use in the financial market.
- This oscillator computes the momentum of ADL using the MACD formula.
- Marc Chaikin developed this method to predict oscillation around ADL, which identifies the pressure of buy and sell taking place for that security.
- It also predicts the market trends and the possibility of reversal, either upward or downward. This guides traders while identifying the entry and exit points that can create a profitable trade.
Chaikin Oscillator Explained
The Chaikin Oscillator is a tool used in the financial market for technical analysis. Traders find it useful in estimating the buy and sell pressure of the security they are trading and identifying market trends. The creator of this concept is Marc Chaikin.
The oscillator uses the formula of MACD to calculate the ADL’s momentum, which is again an important and useful indicator that is used frequently to measure the inflow and outflow of money within a security. In this context, MACD is a trading indicator of technical analysis, which investors can use to understand the entry and exit points.
In this process of the Chaikin oscillator indicator, the calculation considers the three-day Exponential Moving Average (EMA) and 10-day EMA of the AML. Thus, this method is designed in such a way that it can anticipate the change in the direction of the AML because it measures each movement’s momentum.
Trading in security becomes easy and informative by using the above process. Investors and traders can anticipate the trend changes of the underlying security, and the oscillator can generate signals for them.
How To Read?
This section will explain the method used to read and interpret the concept so that it successfully generates trading signals. Since it is specifically used for technical analysis, it can generate early buy or sell signals. It uses a 0 line, which is the ADL, and the oscillator’s movement with respect to that 0 line is used to decide the trade. A positive divergence from the 0 line will indicate that the trader should buy, and a negative divergence from the 0 line will indicate a sell signal.
Commonly, the Relative Strength Index (RSI) is an ideal combination with this oscillator to get confirmed results. Given below is the hourly chart of Bitcoin from TradingView, where the Chaikin is used in combination with the RSI indicator to make the confirmation stronger and easier to understand. For the Chaikin, the red line is the 0 line, with respect to which the oscillator moves.
The area of the oscillator, which is above the 0 line, has a positive divergence, and hence, they are the overbought zones, indicating a possible fall in price in the future. Therefore, the topmost levels of the overbought zones are the exit points for a trader in the case of the Chaikin oscillator indicator.
Similarly, the areas where the oscillator shows a negative divergence by moving below the ADL or the 0 line are the buying zones because they indicate the oversold points, after which there is a possibility of a price rise. Even when the trader looks at the RSI and the Stochastic indicator in the chart below, they see the same signal, confirming the learning from Chaikin.
How To Use In Trade?
The process of using this oscillator is a simple task. As already explained in the above section, the trader should analyze the movement with respect to the 0 line or the red line. Therefore, while trading, one will enter the market or go long on security at a point where the oscillator’s downtrend has ended, and the uptrend has just begun. At this point, the security is in an oversold zone, with a possibility of a bullish market. The opposite will happen in the oversold zone, where the oscillator’s uptrend has ended, and now it is moving downwards. This is an exit point for the trader.
However, the Chaikin oscillator trading strategy should not be used alone; it should be combined with other important indicators like that of RSI, which will provide confidence to the investors regarding the trade decision.
Formula
The calculation of the indicator is as follows:
- Step 1 – The first step is to calculate the Money Flow Multiplier (MFM) for every trading period. The formula for the same is [(Close – Low) – (High – Close)] / (High – Low)
- Step 2 – Next is the calculation of Money Flow Volume (MFV), where the MFM is multiplied by the trading volume.
- Step 3 – Then is the ADL calculation, where the MFV is added to the running total.
- Step 4 – Next is the determination of the 3-period EMA for the ADL.
- Step 5 – Then, the 10-period EMA is determined for the ADL.
- Step 6 – The Chaikin Oscillator value is the result of the difference between the 3-day and 10-day EMA.
Thus, the above is the step-by-step description of how the indicator is calculated.
Examples
Some examples, as given below, will help in understanding the concept of Chaikin oscillator trading strategy.
Example #1
A trader, Mike, wants to trade in the stock of ABC Industries and is waiting for a positive signal to enter the market. The MACD of the stock is trending quite high. He puts the Chaikin Oscillator and checks that there is a bullish divergence from the ADL. He waits until the indicator makes a turn at the highest level, which is the overbought position, and then enters the market with a short position. So here, Mike successfully identified his entry point with the help of the oscillator.
Example #2
Here is another example which clearly shows the calculation of the process. From the example above, where Mike trades in the stock of ABC Industries. The high of the stock is $96.5, the low is $92 and close is 95. Volume is 5.5 million. The period is 7 days (1 week). The 3-day EMA is 0.001, and 10-day EMA is 0.0001.
As per the formula and calculation procedure, the steps will be as follows:
- MFM= [(95-92) – (96.5 – 95)]/ (96.5-92) = 1.5/4.5 = 0.33
- MFV = 0.33 * 5.5 million = 1.81
- ADL = [1.81(7-1)] + (1.81*7) = 10.86 + 12.67 = 23.53
- Chaikin Oscillator = 0.001 – 0.0001 = 0.0009
Benefits
Some benefits of the concept are as follows:
- The trader gets a confirmation regarding the trend of the market with respect to the security they are trading in through convergence and divergence identification. This clearly shows the trend’s direction.
- Investors and traders can use this process for multiple securities and financial instruments like stocks, currencies, commodities, etc.
- It provides an early sign to the trader so that they can make buy or sell decisions based on the indicators and capitalize on the price reversal.
Limitations
Here are some limitations of the system.
- It is considered a lagging indicator because it uses the MACD formula based on past data. Therefore, the indicator may generate signals after the prices have already shown a change in trend. This means the trader will miss out on the entry or exit opportunity.
- Too much volatility or market fluctuation may make this indicator less worthwhile. It may give false signals during times of consolidation.
- Since this indicator primarily identifies trend reversals and gives confirmation regarding buy and sell points, a trending market, which is steadily on the rise or fall, may not find it useful.
Chaikin Oscillator vs Chaikin Money Flow
Both the above financial terms relate to trading and investment in securities, and technical analysis is related to the same. But there are some differences between them, as given below:
- The former is used to measure the momentum in an asset’s accumulation distribution, whereas the latter is used to measure the amount or volume of the money flow.
- The former is a very good indicator for detecting a change in trends, which helps to identify the buy or sell points of security, whereas the latter cannot be used for that purpose because it is related to volume.
- For the former, the indicator measures momentum, where the increase represents a bullish trend, and the decrease represents a bearish trend. However, for the latter, a large volume will indicate a strong momentum and less volume will indicate less momentum.
For professional-grade stock and crypto charts, we recommend TradingView – one of the most trusted platforms among traders.
Disclosure: This article contains affiliate links. If you sign up through these links, we may earn a small commission at no extra cost to you.
Frequently Asked Questions (FAQs)
• What is the main purpose of the Chaikin Oscillator?
The main purpose of the indicator is to determine the buy and sell points, or the point of entry and exit, by looking at the overbought and oversold levels. With this, the trader can easily understand the correct price that will yield a profitable trade for that particular security.
• What are the arguments against the Chaikin Oscillator?
The main argument here is that the indicator strictly uses the 3-day and 10-day EMA. However, if this is changed and a wider level is considered, for instance, 6-day and 20-day EMA, then the change in trend will be less frequent. It can also be argued that, ideally, traders should be able to use it as a standalone indicator, but that will be risky since it has its own limitations and cannot be done.
• How can the trader change the settings of the Chaikin Oscillator to obtain a smoother line?
The default setting used in the indicator is 3 and 10 for the EMA. However, the trader can change it to a higher value to obtain a smoother line. Both the EMAs are taken with double values for this purpose.
Recommended Articles
This has been a guide to what is Chaikin Oscillator. We explain its differences with Chaikin money flow, formula, how to read & use it, examples, & benefits. You may also have a look at the following articles –