Table Of Contents
Central Tendency Definition
Central tendency refers to the value derived from the random variables from the set of data that reflects the center of the data distribution. One may describe it using measures like mean, median, and mode.

It is a single value that describes a data set by identifying the middle of the central position within the given dataset. Sometimes these measures are called the standards of middle or the central location. The mean (otherwise known as the average) is the most commonly used measure for central tendency, but there are other methodologies, such as the median and the mode.
Central Tendency Explained
The central tendency is a concept in the field of statistics which explains the central value in a set of data. It helps in summarising and describing a data set through the identification of a single value which will represent the midpoint of the centre point of the entire distribution.
Most widely used methods of calculating the central tendency theorem is through mean, median and mode. Each of the methods have their own formula and steps to calculate the central tendency. However, each of them also have some positive and negative side, which should be considered while deciding which method will be ideal for which situations. It is important to select the method based on type and nature of data, the objective of analysis, and so on.
Sometimes the methods are also combined to get more effective results and get a proper or more detailed understanding of the entire numerical information. It is also necessary to understand that it may not be possible to calculate all three measures from any set of data.
Typically means is used in maximum of cases and mode is the least applied method. Median is commonly used in case of outliers which are values that differ from the main data set. This is because they usually tend to distort the mean value. Therefore there is no such method of the concept that can be assumed to be the best.
Types
As already identified above, there are three methods or types of central tendency. They are:
- Mean – This can also be explained as the average of all the values in a data set. This is the calculation of arithmetic average which takes into account the sum total of all the values and divides it by the total number of values. The mean can be influenced by values that differ significantly from the actual data which are called outliers and also normally avoided in case of skewed data.
- Median – Median represents the entire data set’s middle value which and it is important to arrange the numerical data in an ascending or descending order so that the actual middle value can be depicted. It is widely used for distributions that are skewed and also in case or ordinal numbers which represent a position or a rank among group of people or objects.
- Mode – This depicts the data which occurs most frequently in the set. There can be one , two or multiple modes in a set of data and is very useful in identifying categories that are very common.
Thus, the above are three common types of the concept that are used in statistics.
Formula
Now let us try to understand the formula for various central tendency theorem methods.
For Mean x,

Where,
- ∑x is the sum of all the observations in a given dataset
- n is the number of observations
The mean or the average is the sum of all the observations in the given data set divided by the number of observations in the given data set. So, if there are n observations in a given set of data and they have observations such as x1, x2, …, Xn, then taking some of those is total and dividing the same by observations is mean, which tries to bring a central point.
The Median formula is :
1- If the number of values is even, median will be taken as the average of two middle values. 2- If the number of values is odd, median will be taken as the middle value of the entire set.
The median will be the center score for a given dataset, arranged in order of magnitude. The median is the middle value of the observations and is mostly reliable when the data has outliers.
The Mode formula is :
The mode will be the most frequent score in the data set. One can use a histogram chart to identify the same. Hence will be preferred over the mean only when there are such samples where values repeat them the most.
Examples
Let us try to understand the concept of central tendency measures with the help of some suitable examples.
Example #1
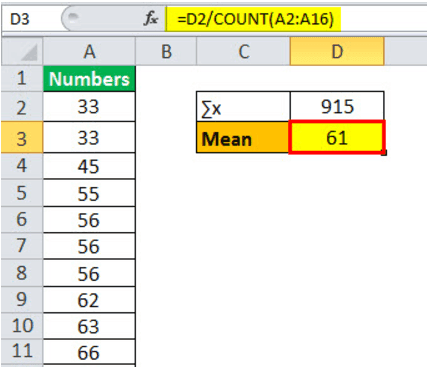
Consider the following sample : 33, 55, 66, 56, 77, 63, 87, 45, 33, 82, 67, 56, 77, 62, 56. You are required to come up with a central tendency.
Solution:
Below is the given data for calculation.

Using the above information, the calculation of the mean will be as follows:

- Mean = 915/15
Mean will be –

Mean = 61
The calculation of the median will be as follows:

Median =62
Since the number of observations is odd, the middle value, the 8th position, will be the median, 62.
The calculation of mode will be as follows:

Mode = 56
From the above table, we can note that the number of recurring observations most often is 56. (3 times in the dataset).
Example #2
Ryan international school is considering selecting the best players to represent them in the inter-school Olympics competition to be organized soon. However, they have observed that their players are spread across the sections and standards. Hence, before putting a name in any of the contests, they like to study the central tendency of their students in height and weight.
Height qualification is at least 160cm, and weight should not be more than 70 kgs. You are required to calculate the central tendency for their students in terms of height and weight.
Solution:
Below is given data for the calculation of measures of central tendency.

Using the above information, the calculation of the mean of height will be as follows:

= 2367/15
Mean will be -

- Mean = 157.80
The number of observations is 15. Hence the mean height would be 2367/15 = 157.80, respectively.
Therefore, one can calculate the median of height as:

- Median = 155
The median would be the 8th observation as the number of observations is odd, which is 155 for weight.
Therefore, one can calculate the mode of height as,

- Mode = 171
Therefore, one can calculate the mode of height as:

= 1047.07/15
The mean of weight will be –

- Mean = 69.80
Therefore, one can calculate the median of weight as:

- Median =69.80
The median would be the 8th observation as the number of observations is odd, which is 69.80 for weight.
Therefore, one can calculate the mode of weight as:

- Mode = 77.00
Now, the mode will be the one that occurs more than one time. As can be observed from the above table, it would be 171 and 77 for height and weight, respectively.
Analysis: It can be observed that the average height is less than 160 cm. However, weight is less than 70 kgs, which could mean Ryan’s school students might not qualify for the race.
The mode does now show proper central tendency and is biased upwards. However, the median is still showing good support.
Example #3
The universal library has the following count of the most to read books from different clients. They are interested in the central tendency of books read in their library. Now, you need to calculate central tendency and use mode to decide the no one reader.
Solution:
Below is the given data for calculation of central tendency measures.

Using the above information, the calculation of the mean will be as follows:

Mean =7326/10
Mean will be -

- Mean = 732.60
Therefore, the median one can calculate as follows,

Since the number of observations is even, there would be two middle values: the 5th and 6th position will be the median, which is (800 + 890)/2 = 845.
- Median = 845.00
Therefore, one can calculate the model as follows:

- Mode = 1101.00
We can use below the histogram to find out the mode, which is 1100, and the readers are Sam and Matthew.

Advantages And Disadvantages
Let us look at the advantages and disadvantages of the central tendency in statistics.
Advantages:
- It helps in representing the data is a summarized or concise form which is easy to interpret and use since the final result is just one value.
- It is a concept that can be easily understood and communicated in a very straightforward manner.
- The main reason of using such a concept in statistics is ease of comparison. The calculation made and values derived from the above tree methods are frequently used to compare similar situations and analyse which is better. It is widely used for comparison of income, customer taste and preferences, population increase or decrease, etc.
- Decision making is hugely dependent of usage of these methods in various fields like healthcare, business, finance. It helps in deciding sales targets of prices or goods and services.
- The methods play a crucial role in various testing of hypothesis. Researchers commonly use them to identify differences in groups.
- These measures provide a good way of visually understanding data sets and interpreting them. This provides additional information or insights into the same.
Disadvantages:
- Among all the methods of central tendency in statistics, the mean is influenced by outliers, which makes it unsuitable for using data sets with some values significantly different from the others.
- Mean cannot be used if the data is skewed. It is suitable only when the distribution is totally normal.
- Median works fine for odd number of values but in case the total items are even number, then it becomes necessary to calculate an average of the middle values. It is also necessary to arrange them in ascending or descending order, which may be time consuming.
- Mode does not show any unique value, resulting in discrepancy in case there are multiple values with same frequency. It also makes the data confusing in case the most frequent mark is far away from the rest of the data.
Thus, the above are some of the pros and cons of this concept of central tendency of grouped data involving three types of measures.
Uses
All the measures of central tendency are used widely. They are very useful to extract the meaning of the data, which gets organized, or if someone is presenting that data in front of a large audience and wishes to summarize it. These measures are used everywhere in fields like statistics, finance, science, education, etc. But commonly, you would hear more of the use of mean or average daily.
Central Tendency Vs Dispersion
Both the above are two different types of statistical measures which describe numerical information. However, there are some differences between them as follows:
- The central tendency of grouped data describes the centre point of middle point of a set of values whereas the latter describes how much spread out of variable or closely packed the information is.
- The former is measures using mean, median or mode and the latter is measured using variance, range, standard deviation, etc.
- The former depicts how the entire set can be represented using one value, whereas the latter depicts how much each data varies or deviates from the middle.
Thus, the above are some important differences between the two concepts.

