Table Of Contents
Central Limit Theorem Definition
The central limit theorem is a sampling distribution theory. It states that normal distribution can be attained by increasing sample size. Thus, the population mean is represented by the average of random sample means.
For every sample size equal to or larger than 30, a normal sample distribution is achieved. This is irrespective of the population size. A bell-shaped curve represents the average sample size. In probability, this theory is used for acquiring approximate results when multiple random samples are taken.

Key Takeaways
- The central limit theorem (CLT) states; when the sample size is large (30 or more), the sample distribution is very close to the normal distribution of the population.
- Even non-normal population distributions can provide accurate results after many rounds of sampling. These samplings comprise a large number of random variables.
- CLT is widely used in healthcare, economics, finance, and business. The theorem is applied for obtaining results that are close to actual outcomes.
Central Limit Theorem in Statistics Explained
The central limit theorem (CLT) is simply a statistical phenomenon. It concludes that normal population distribution is achieved when repetitive random samples are tested with large sample sizes—multiple sampling results in a bell-shaped curve resembling the normal distribution. Also, as the sample size increases, the variance of the sample mean reduces, providing a more accurate distribution (almost replicating the population distribution). CLT is widely used in healthcare, economics, finance, and business. The theorem is applied for obtaining results that are close to actual outcomes. In statistics, this concept is applied for determining the binomial probability of a data series.
However, CLT is applicable only when the variables fulfill all the conditions required for the computation of the mean. For applying this theory, the variables have to be independent and identical. Moreover, there should be a finite variation among the variables, and the sample size should be 30 or more to validate the theory. This theory is based upon the law of large numbers. According to this law, with the escalation of sample size, the average of all the sample means corresponds to the population mean. Further, the standard deviation of the sample is the standard deviation of the population divided by the square root of the sample size.
It was French mathematician Abraham De Moivre who introduced the central limit theorem in 1733. He explained the normal distribution concept by counting the number of heads observed on repeated tossing of a coin. In 1901, the central limit theory was further developed for a general mathematical application by the Russian mathematician Aleksandr Lyapunov. Modern concepts and uses of the CLT were redefined by George Polya. Polya was a Hungarian mathematician.
Central Limit Theorem Formula
The central limit theorem sets forth that the average of the sample means gives the population mean.

The central limit theorem is calculated using the following formula.
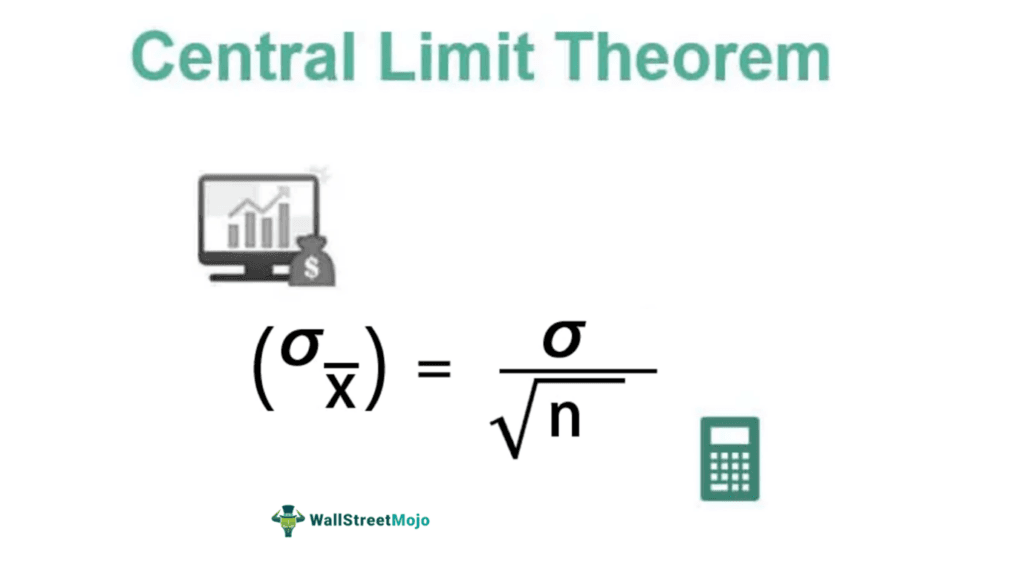
The sample's standard deviation is computed by dividing the population's standard deviation by the square root of sample size:

Here,
σ is the population standard deviation,
σx is the sample standard deviation; and
n is the sample size
Example #1
To better understand the calculation involved in the central limit theorem, consider the following example.
In a country located in the middle east region, the recorded weights of the male population follow a normal distribution. The mean and the standard deviations are 70 kg and 15 kg, respectively. If a person is eager to find the data for 50 males of the population, what would be the mean and standard deviation of the chosen sample?

Solution:
The mean of the sample is the same as the mean of a population.

The mean of the population is 70 since the sample size is >30.
Sample Standard Deviation is calculated using the formula given below:
σx= σ/√n

- Sample Standard Deviation = 15 / √50
- Sample Standard Deviation = 2.12
Example #2
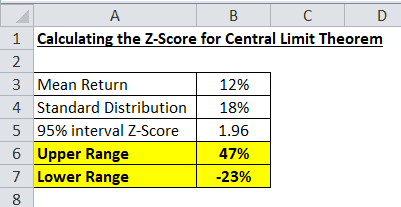
The average return from a mutual fund is 12%, and the standard deviation from the mean return for the mutual fund investment is 18%. If we assume that the distribution of the return is normally distributed, then we can interpret the distribution for the returns from a mutual fund.
Given;
- The mean return for the investment will be 12%
- The standard deviation will be 18%

So, to find the returns for a 95% confidence interval, we solve the following equation.

- Upper Range = 12 + 1.96(18) = 47%
- Lower Range = 12 – 1.96(18) = -23%
The result signifies that 95% of the time, the returns from the mutual fund will be in the range of 47% to -23%. In this example, the sample size of more than 30 observations gave us the population returns from the mutual fund. According to CLT, the sample distribution was normally distributed.
Central Limit Theorem Application
The concept of the central limit theorem is widely applied for business research and financial analysis. For example, a company operates a chain of 250 outlets in a country. The head office needs to determine the overall inventory volume to be maintained for a five-day backup. Now, the company can conduct three random samples of 30 stores each time and apply the CLT to figure out the approximate total inventory volume for five days.
Similarly, in many brick-and-mortar stores, CLT is used to compute the estimate for the overall requirements. CLT can also be applied when conducting market research for interpreting consumer preference, spending, income, and numerical data analysis.
In finance, investors use CLT to estimate the possible returns of an investment product like mutual funds, stocks, and indexes. For instance, to determine the performance of the S&P 500, an investor can take a sample of roughly 50 random stocks from the list and apply CLT to figure out the approximate returns of this index. Investors employ a similar method to analyze the levels of risk involved in a financial product. CLT, therefore, is a decent statistical technique that can be used to form a suitable investment portfolio.

