What Is Categorical Data?
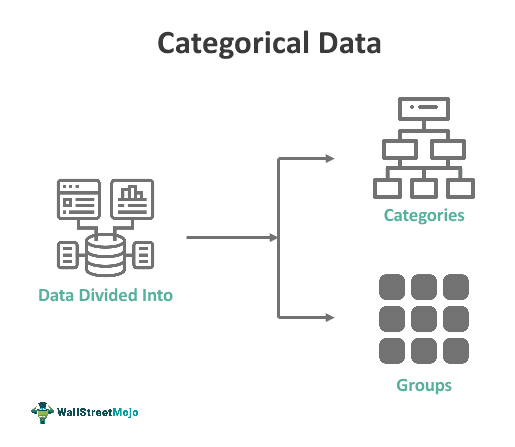
Categorical data is a type of data that represents categories or distinct groups rather than numerical values. It is used to classify items or classes based on qualitative characteristics. These categories are often mutually exclusive and do not have a natural order or numerical value associated with them.

Categorical data analysis helps identify patterns and trends in data, enabling businesses and researchers to make informed decisions and predictions. It allows for statistical inference and hypothesis testing to determine if there are significant differences or relationships between categorical variables. This analysis is fundamental in segmenting populations or groups based on characteristics and classifying data into meaningful categories, which aids in target marketing and customer profiling.
Key Takeaways
- Categorical data classifies items into distinct categories or labels based on qualitative characteristics, making it suitable for organizing and summarizing data.
- There are two main types of categorical data: nominal and ordinal. Nominal data has no inherent order, while ordinal data has categories with a meaningful hierarchy.
- Categorical data represents non-numeric attributes and is often used to describe attributes such as gender, color, education level, or vehicle type.
- Analyzing categorical data involves techniques like frequency tables, chi-squared tests, contingency tables, and logistic regression to uncover patterns and relationships among categories.
Categorical Data Explained
Categorical data refers to a type of data that classifies items into distinct groups or categories based on qualitative characteristics rather than numerical values. Unlike continuous data, which consists of numbers on a scale, categorical data assigns data points to discrete and often non-numeric categories. These categories are typically mutually exclusive, meaning that each data point falls into one and only one category.
Categorical data is a fundamental component of data analysis, and understanding its nature is essential for various purposes, such as statistical analysis, data visualization, and decision-making. When working with categorical data, analysts typically employ techniques like contingency tables, chi-square tests, and logistic regression to uncover relationships, dependencies, or patterns among the categories. These analyses help researchers and businesses make informed decisions, develop marketing strategies, and gain insights into customer behavior, among other applications.
Types
Categorical data is divided into two primary types: nominal and ordinal, each with distinct characteristics and applications.
#1 – Nominal Data
Nominal data represents categories or labels without inherent order or ranking. These categories are mutually exclusive, and data points are assigned to specific groups. Nominal data is used to classify items into distinct, unrelated categories. Examples include:
- Colors: Categorizing objects by color (e.g., red, blue, green).
- Gender: Classifying individuals as male, female, or non-binary.
- Animal Types: Grouping animals into categories like mammals, birds, and reptiles.
Nominal data is often analyzed using frequency counts and percentages to understand the distribution of categories within a dataset.
#2 – Ordinal Data
Unlike nominal data, ordinal data has a meaningful order or hierarchy among its categories. While the intervals between categories are not necessarily equal or well-defined, there is a clear sense of “more” or “less.” Examples include:
- Education Levels: Ranking individuals by educational attainment (e.g., high school, bachelor’s degree, master’s degree).
- Customer Satisfaction: Assessing satisfaction levels from “very dissatisfied” to “very satisfied.”
- Economic Status: Categorizing households as low-income, middle-income, or high-income.
Ordinal data enables the interpretation of relative positions or preferences, making it suitable for ranking and comparisons. However, it must provide precise information about the magnitude of differences between categories.
Examples
Let us check out a few examples:
Example #1
Suppose Tim is a school administrator and wants to gather data on food preferences among students in his school cafeteria. He categorizes students into different groups based on their food choices:
- Pizza Lovers: Students who prefer pizza as their primary food choice.
- Vegetarian: Students who opt for vegetarian dishes only.
- Sandwich Enthusiasts: Those who enjoy sandwiches the most.
- Salad Fans: Students who predominantly choose salads.
- Others: This category includes students with diverse food preferences not covered in the above categories.
Analyzing this categorical data can help Tim and the school cafeteria staff plan their menu and ensure various food options to cater to different preferences, promoting healthier eating habits among students.
Example #2
Forbes, in 2023, published an article titled “Five Key Commandments of Data Visualization,” in which the importance of effective data visualization was emphasized. The article underscores the significance of clear and impactful data representation, a critical aspect of dealing with categorical data.
The article highlights that categorical data, which includes non-numeric attributes like labels and categories, plays a pivotal role in data visualization. It emphasizes that understanding and appropriately presenting this data type is essential for creating informative visualizations. Businesses and analysts can derive meaningful insights and make data-driven decisions by categorizing and grouping data effectively.
Advantages And Disadvantages
Advantages
- Easy to Understand: Categorical data is easy to comprehend as it represents distinct categories or labels.
- Applicability: It is suitable for representing qualitative attributes and attributes that do not have numerical values.
- Simplicity: Categorical data simplifies complex information into manageable categories, making it accessible for non-specialists.
- Interpretability: Categorical data allows for straightforward interpretation and communication of results.
- Non-linear Relationships: It can capture non-linear relationships or patterns that may not be evident in numerical data.
- Useful for Classification: Categorical data is essential for tasks like classification and segmentation, aiding decision-making.
Disadvantages
- Limited Information: Categorical data lacks the precision of continuous data and may not capture subtle variations
- Limited Analytical Techniques: Categorical data analysis often requires specific statistical methods designed for discrete variables.
- Loss of Information: When converting continuous data into categorical data, there can be a loss of information due to the grouping process.
- Arbitrary Categories: The creation of categories may involve subjective decisions, leading to potential bias.
- Limited Statistical Power: Statistical tests on categorical data may have reduced power compared to those on continuous data, affecting the ability to detect effects.
- Difficulty Handling Many Categories: Large numbers of categories can complicate analysis and visualization.
Difference Between Continuous And Categorical Data
Below is a brief representation highlighting the critical differences between continuous and categorical data:
Categorical Data vs Numerical Data
Here’s a short comparison of categorical data and numerical data:
Frequently Asked Questions (FAQs)
What are the challenges associated with categorical data analysis?
Challenges include handling missing data, dealing with many categories, and selecting appropriate statistical methods, especially for ordinal data.
Can categorical data be converted into numerical data?
Yes, categorical data can be transformed into numerical form through one-hot encoding or label encoding, making it suitable for some machine learning algorithms.
What is the importance of distinguishing between nominal and ordinal data?
Distinguishing between nominal and ordinal data is crucial because it affects the choice of statistical methods and the interpretation of results. Ordinal data, with its inherent order, allows for rank-based analyses.
How is categorical data visualized?
Categorical data is often visualized using bar charts, pie charts, stacked bar plots, and other graphical representations highlighting the distribution and relationships among categories.
Recommended Articles
This article has been a guide to what is Categorical Data. We explain its examples, comparison with numerical and continuous data, types, advantages & disadvantages. You may also find some useful articles here –