Table Of Contents
What Is The Case-Shiller Index?
The Case-Shiller index explains the repeated sales of a real estate property or single-family house that helps curate the house price index for the U.S. The index became popular after the economists Karl Case and Robert Shiller developed the repeat sales methodology to analyze housing inflation in the U.S economy.
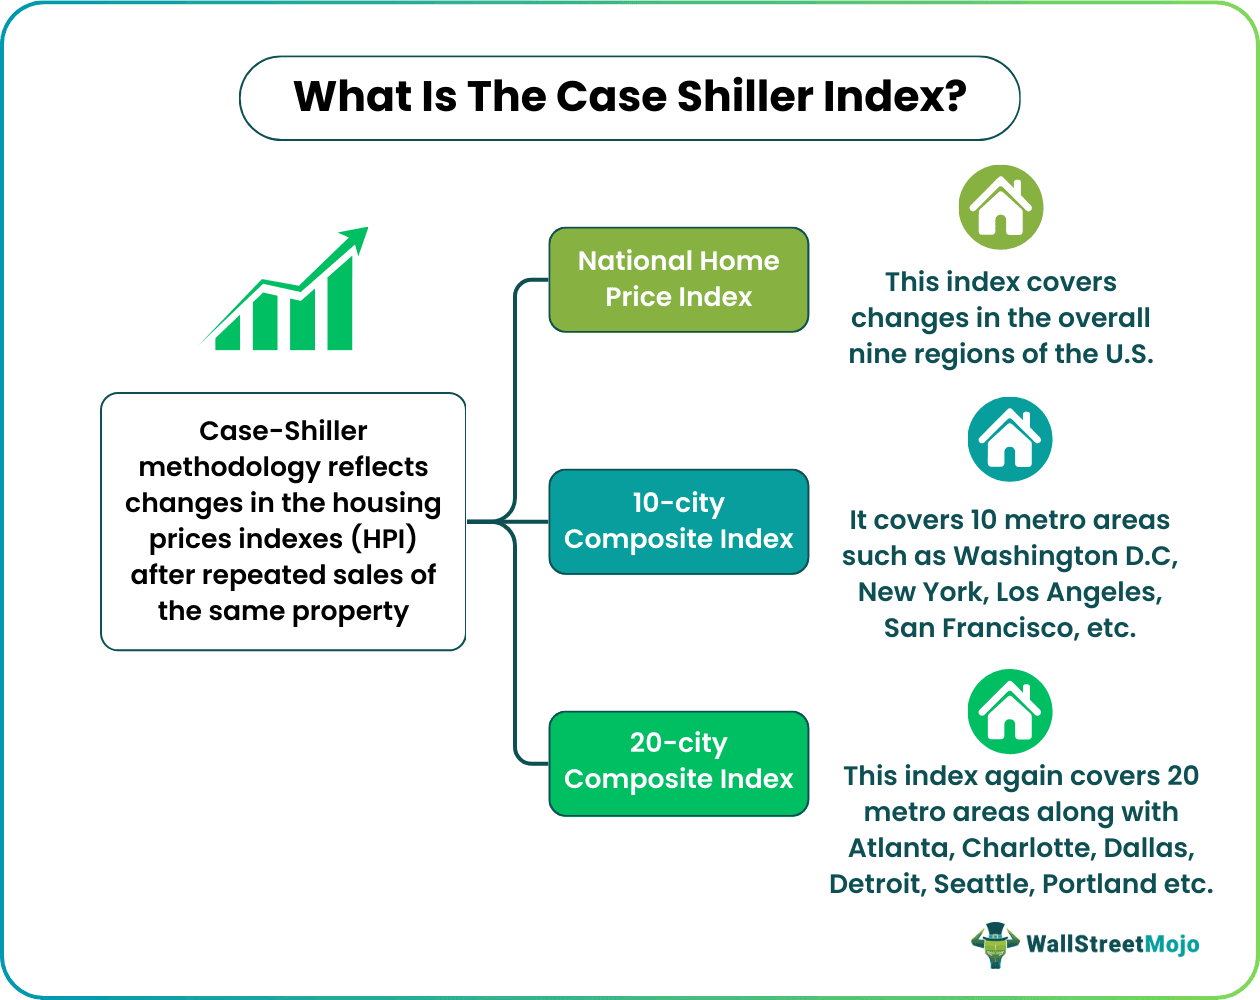
The Case-Shiller index methodology was developed in the 1980s by three economists to track monthly changes in residential home prices in the U.S. compositely and for popular metro areas. Case-Shiller methodology assists S&P’s analytics division in releasing three major housing indexes – the National Home Price Index, a composite statistics of nine U.S. regions, and two other, a 10-city composite index and a 20-city composite index.
Table of contents
- What Is The Case-Shiller Index?
- The Case-Shiller index is an index released by S&P that tracks changes in the sale prices of single-family houses in the U.S.
- The index uses the repeated-sales methodology and ensures that the property sale takes place only through an arms-length transaction. It means that both the buyer and the seller act in their interest while determining the property’s sale price.
- Housing is an important economic variable that reflects economic trends and consumer confidence in the U.S.
- Additionally, the index assists economists in accurately seeing the effect of inflation on house prices and home sales.
Case-Shiller Index Explained
The Case-Shiller index was also known as S&P CoreLogic Case-Shiller U.S. National Home Price NSA Index. It is a group of indexes that measures the price changes in single-family houses based on a three-month average released by S&P’s CoreLogic division. The composite indices are updated on the last Tuesday of every month, but with a lag of two months. Thus, the indices updated for July reveal prices for May.
However, the national home price index calculation considering nine census regions of the U.S. takes place quarterly and gets released on the last Tuesday of February, May, August, and November.
The Case-Shiller methodology helps determine actual market prices from the repeated sale of the houses. Although, the assumption and requirement for unbiased results demand that the buyer and seller act in their interest. Thus, in case of friendly relations between the seller and buyer of the property, the index will not record these price changes. Therefore, this method eliminates unfair pricing or conflict of interest, pressuring the determination of the selling price. This pricing strategy is also known as an arms-length transaction.
The calculation of a housing index indicates the health of the broader U.S. economy. The developing economic changes indicate the likely behavior of U.S. households and consumers toward housing or home sales. Thus, the index observes the differences in the purchase price and resale value for houses sold through arms-length transactions consecutively.
Additionally, the index allows analysts to study changing housing prices in different geographical areas of a country. The influencing factors include interest rates, changing incomes or revenues, population shifts, infrastructure, and other local market changes. For instance, a rapidly urbanizing area will have higher housing demand than another area with slower economic activities or small markets.
Chart
The chart below shows an overview of three years (September 2019 to May 2022) and changes in prices of single-family properties or houses for Boston in the S&P CoreLogic Case-Shiller index for 20 individual metro areas. The organization releases composite and individual indexes for these 20 cities.
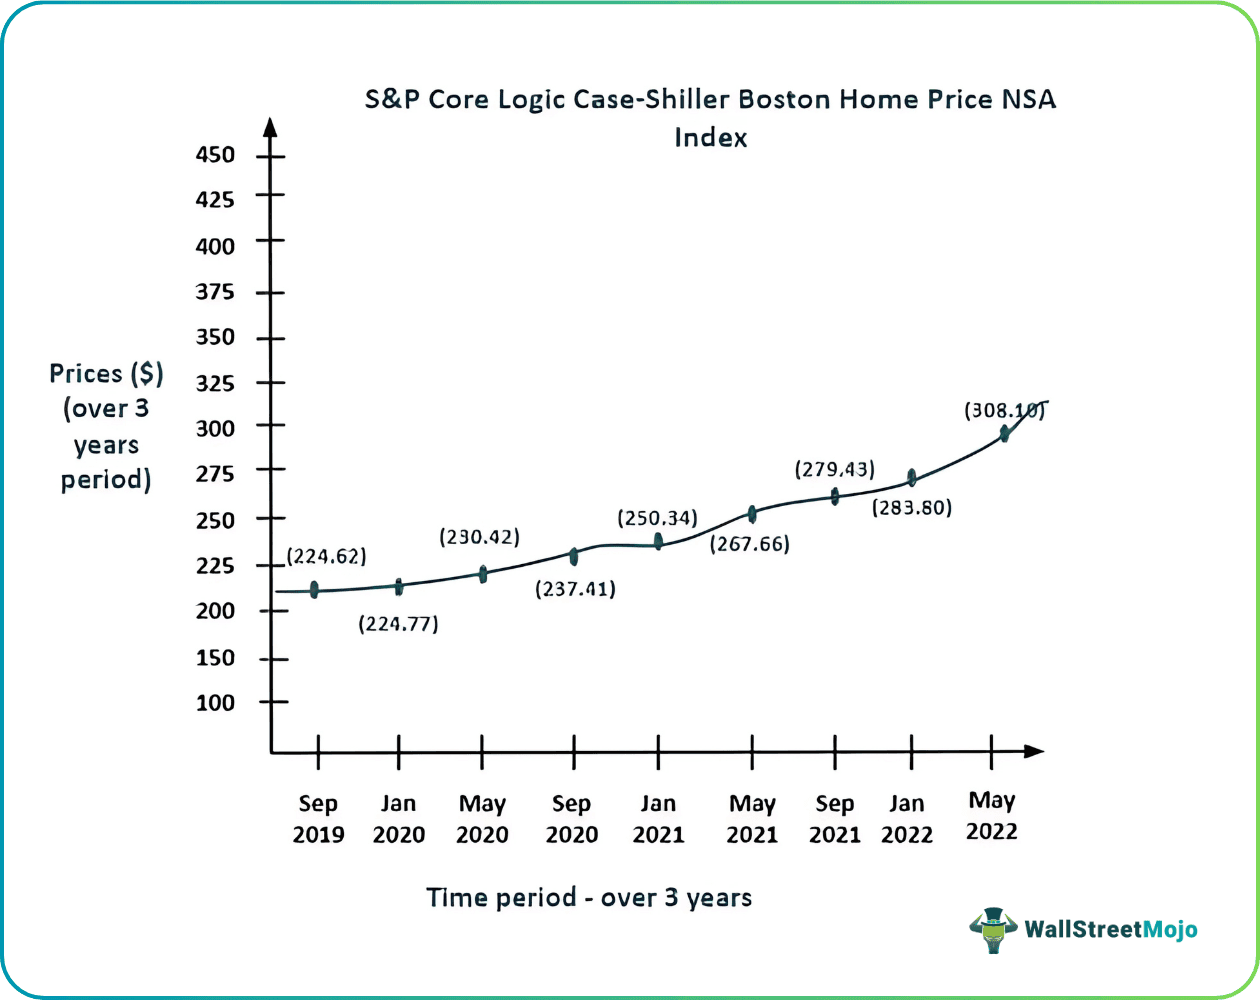
The rising prices shown in the Boston Case-Shiller index graph usually result from high economic interest rates or consumer confidence. However, additional factors such as a rise in demand due to shifts in population, rapid urbanization, and changes in revenues could also lead to higher demand amongst the residents for housing, thereby soaring prices. The changes in such variables collectively represent the state of the economy for analysts.
S&P’s real estate analytics division CoreLogic accumulates data from deed registries and other offices that record real-estate property transactions. Consequently, the publisher takes three months to roll out the results to offset delays and record accurate sales. The publisher can also cover a large sample size to produce detailed records and analysis.
The changes recorded are through the repeat-sales methodology. It analyses data for single-family properties that have undergone two or more consecutive sales transactions. Additionally, S&P records only arms-length transactions of properties.
Case-Shiller Index vs S&P 500
Let us compare and contrast the two indexes released by the Standard and Poor (S&P) 500:
| Case-Shiller Index | S&P 500 |
| S&P Case-Shiller Index records the changes in the prices of consecutively selling single-family houses for different regions of the U.S. | S&P 500 Index weights the changes in the market capitalization or valuation of leading 500 publicly traded companies in the U.S. |
| Economists and analysts use these indices to understand housing demand and compare real-estate prices across different regions. | Portfolio or private-equity investors refer to this index to understand the performance and changes in the valuation of equity shares for these leading 500 companies. |
| Households and real-estate investors may refer to this index while building houses or making property purchases to get an idea of average rates. | The index largely dictates the investment decisions of retail, institutional, and portfolio investors by helping them estimate their returns. |
| It uses the Case-Shiller methodology that calculates the difference between the selling price of the same single-family house, sold consecutively through the arms-length transaction. | It uses the market-capitalization weighting method, which explains that companies with a higher market capitalization have a higher weight. At the same time, companies with small capitalization will have lesser weight and effect on the overall index. |
| S&P thus releases three indices, categorizing city composite indexes into three price tiers- low, medium, and high. In addition, it categorizes houses by their first sale price and not the consecutive sale prices of the house in a sale pair. | In the S&P500 index, each company is weighed by calculating its market capitalization and dividing it by the index’s total market capitalization. |
| It is a barometer for housing prices in the U.S. | It is a barometer for the U.S stock market as it holds the largest existing market capitalization (80%), influencing equities, mutual funds, ETFs, etc. |
Frequently Asked Questions (FAQs)
The S&P CoreLogic Case-Shiller 20-city composite home price NSA index includes; Atlanta, Boston, Chicago, Charlotte, Cleveland, Denver, Dallas, Detroit, Las Vegas, Los Angeles, Minneapolis, Miami, New York, Portland, Phoenix, San Francisco, Seattle, San Diego, Tampa, Washington D.C.
Yes, the Case-Shiller index adjusts the house prices with the rising inflation. It records the actual selling price of the house or purchase price for an owner. This record helps eliminate people’s general perception or misinformation about the extremely high or rising prices of single-family houses or real estate properties. Thus, by recording the accurate increase or change in prices, the Case-Shiller index assists in determining actual cost and inflationary pressures leading to changes in the cost of a house.
The basis for calculating the index is the repeated sales methodology through an arms-length transaction. It aims to ensure that the buyer and seller act in their interest. Thus, it tries to eliminate conflict of interest in determining the prices. After that, the index categorizes the prices into three-tier- low, medium, and high. However, the basis for categorizing houses is the first sale price of the house property.
Recommended Articles
This has been a guide to What is Case Shiller Index and its meaning. Here, we explain it through a chart and compare it with S&P 500 Index. You may also find some useful articles here -
