Table Of Contents
What Is The CAPM Beta?
Beta is a very important measure that is used as a key input for Discounted Cash Flow or DCF valuations.
Key Takeaways
- CAPM Beta is a concept used to gauge how a specific stock moves in relation to the overall market, achieved by assessing its correlation. While the market addresses unsystematic risk, Beta quantifies systematic risk.
- Stock risks are categorized into two types: non-systematic and systematic. Non-systematic risks can be mitigated through diversification, whereas systematic risks influence the entire market and remain unavoidable.
- BETA is a vital metric for measuring systematic risk.
- Investments in gold and international companies might exhibit a negative beta due to their inverse correlation with the stock market and their limited direct ties to the domestic economy.
CAPM Beta Formula
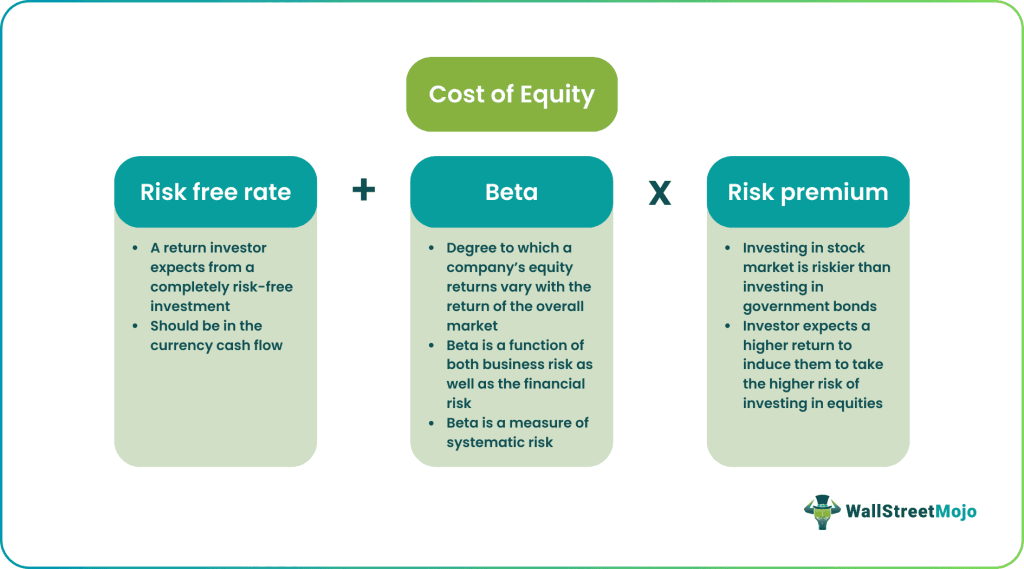
If you have a slightest of the hint regarding DCF, then you would have heard about the Capital Asset Pricing Model (CAPM) that calculates the Cost of Equity as per the below Beta formula.
Cost of Equity = Risk Free Rate + Beta x Risk Premium
If you have not heard of Beta yet, then worry not. This article explains to you about Beta in the most basic way.
Let us take an example: when we invest in stocks, it is but human to pick stocks that have the highest possible returns. However, if one chases only returns, the other corresponding element is missed, i.e., Risk.
Actually, every stock is exposed to two types of risks.
- Non-Systematic Risks include risks that are specific to a company or industry. This kind of risk can be eliminated through diversification across sectors and companies. The effect of diversification is that the diversifiable risk of various equities can offset each other.
- Systematic Risks are those risks that affect the overall stock markets. Systematic risks can't be mitigated through diversification but can be well understood via an important risk measure called "BETA."
Video Explanation Of CAPM Beta
What is Beta?
Basic Definition of Beta - Beta measures the stock risks in relation to the overall market.
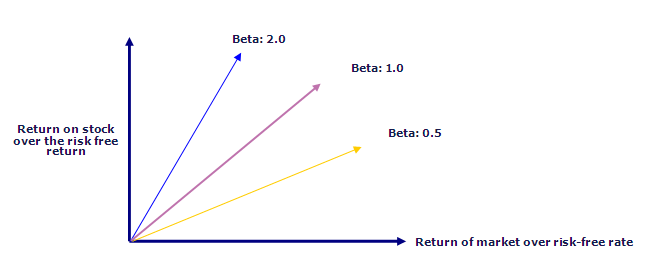
- If Beta = 1: If the Beta of the stock is one, then it has the same level of risk as to the stock market. Hence, if the stock market (NASDAQ and NYSE, etc.) rises up by 1%, the stock price will also move up by 1%. If the stock market moves down by 1%, the stock price will also move down by 1%.
- If Beta > 1: If the Beta of the stock is greater than one, then it implies a higher level of risk and volatility as compared to the stock market. Though the direction of the stock price change will be the same; however, the stock price movements will be rather extremes. For example, assume the Beta of the ABC stock is two, then if the stock market moves up by 1%, the stock price of ABC will move up by two percent (higher returns in the rising market). However, if the stock market moves down by 1%, the stock price of ABC will move down by two percent (thereby signifying higher downside and risk).
- If Beta >0 and Beta<1: If the Beta of the stock is less than one and greater than zero, it implies the stock prices will move with the overall market; however, the stock prices will remain less risky and volatile. For example, if the beta of the stock XYZ is 0.5, it means if the overall market moves up or down by 1%, XYZ stock price will show an increase or decrease of only 0.5% (less volatile)
In general, large companies with more predictable Financial Statements and profitability will have a lower beta value. For example, Energy, Utilities, and Banks, etc., all tend to have a lower beta. Most betas normally fall between 0.1 and 2.0 though negative and higher numbers are possible.
Key Determinants of Beta
Now that we understood Beta as a measure of Risk, it is important for us to also understand the sources of risks. Beta depends on a lot of factors - usually, the nature of the business, operating and financial leverages, etc.
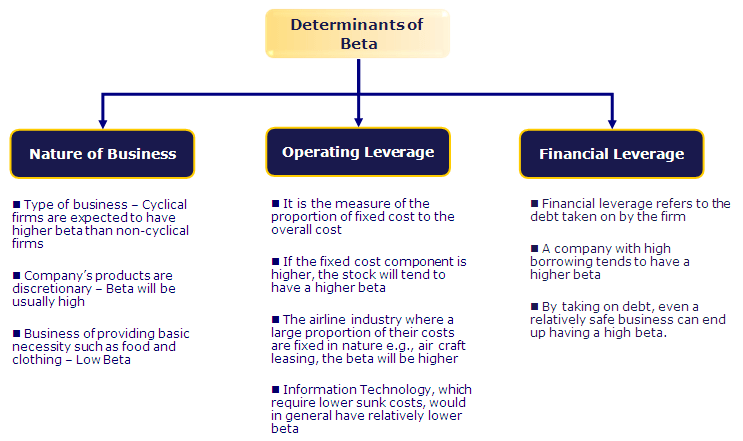
The below diagram shows the key determinants of Beta -
- Nature of Business - The beta value for a firm depends on the kind of products and services offered and its relationship with the overall macro-economic environment. Note that Cyclical companies have higher betas than non-cyclical firms. Also, discretionary product firms will have higher betas than firms that sell less discretionary products.
- Operating leverage: The greater the proportion of fixed costs in the cost structure of the business, the higher the beta
- Financial leverage: The more debt a firm takes on, the higher the beta will be of the equity in that business. Debt creates a fixed cost, interest expenses that increase exposure to market risks.
High Beta Stocks/Sectors
Due to the uncertain economic environment, questions always remain on what is the best investment strategy. Should I pick high CAPM Beta stocks or Low CAPM Beta Stocks? It is normally understood that cyclical stocks have high Beta and defensive sectors have low Beta.
Cyclical stocks are those whose business performance and stock performance is highly correlated with economic activities. If the economy is in recession, then these stocks exhibit poor results, and thereby stock performance takes a beating. Likewise, if the economy is on a high growth trajectory, cyclical stocks tend to be highly correlated and demonstrate a high growth rate in business and stock performances.
Take, for example, General Motors; its CAPM Beta is 1.43. This implies if the stock market moves up by 5%, then General Motors stock will move up by 5 x 1.43 = 7.15%.
The following sectors can be classified as cyclical sectors and tend to exhibit High Stock Betas.
- Automobiles Sector
- Materials Sector
- Information Technology Sector
- Consumer Discretionary Sector
- Industrial Sector
- Banking Sector
Low Beta Stocks/Sectors
Low Beta is demonstrated by stocks in the defensive sector. Defensive stocks are stocks whose business activities and stock prices are not correlated with economic activities. Even if the economy is in recession, these stocks tend to show stable revenues and stock prices. For example, PepsiCo, its stock beta is 0.78. If the stock market moves down by 5%, then Pepsico stock will only move down by 0.78x5 = 3.9%.
The following sectors can be classified as defensive sectors and tend to exhibit Low Stock Betas-
- Consumer Staples
- Beverages
- HealthCare
- Telecom
- Utilities
CAPM Beta Calculation in Excel
Technically speaking, Beta is a measure of stock price variability in relation to the overall stock market (NYSE, NASDAQ, etc.). Beta is calculated by regressing the percentage change in stock prices versus the percentage change in the overall stock market. CAPM Beta calculation can be done very easily on excel.
Let us calculate the Beta of MakeMyTrip (MMTY) and Market Index as NASDAQ.
Most Important - Download Beta Calculation Excel Template
Calculate the BETA of MakeMyTrip in Excel using SLOPE and Regression
Step 1 - Download the Stock Prices & Index Data for the past 3 years.
The first step is to download the stock price and Index data. For NASDAQ, download the dataset from Yahoo Finance.
Likewise, download the corresponding stock price data for the MakeMyTrip example from here.
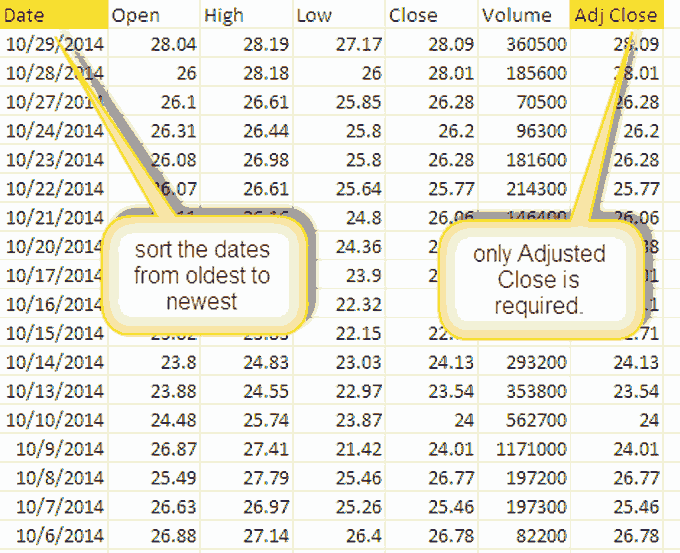
Step 2 - Sort the Dates & Adjusted Closing Prices
Once you have downloaded the data set for the two, please do the following for each of the data set-
- Sort the dates and Adjusted Closing prices in ascending order
- Delete Open, High, Low, Close & Volume Column. They are not required for Beta Calculations.
Step 3 - Prepare a single sheet of Stock Prices Data & Index Data.
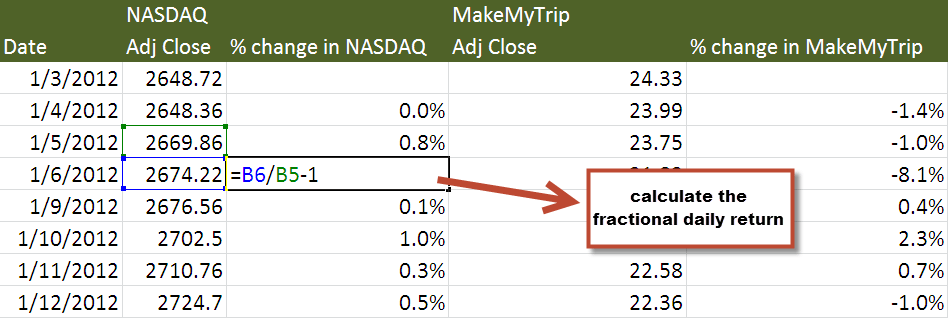
Step 4 - Calculate the Fractional Daily Return
Step 5 - Calculate Beta - Three Methods
You can use either of the three methods to calculate Beta - 1) Variance/Covariance Method 2) SLOPE Function in excel 3) Data Regression
- Variance / Covariance Method
Using the variance-covariance method, we get the Beta as 0.9859 (Beta Coefficient)
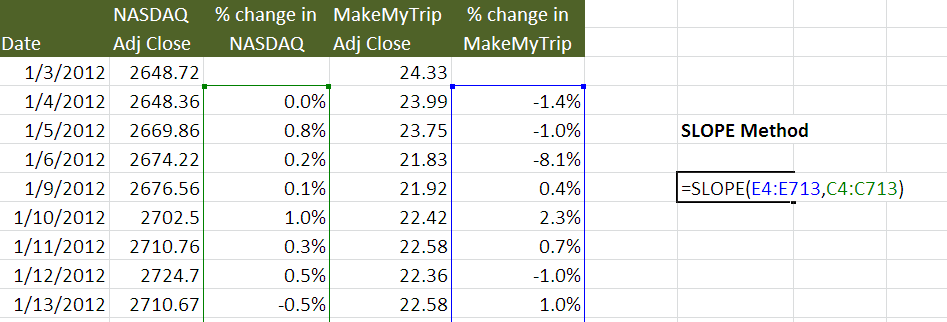
- SLOPE function in excel
Using this SLOPE function method, we again get the Beta as 0.9859 (Beta Coefficient)
- 3rd Method - Using Data Regression
For using this function in excel, you need to go to the Data Tab and select Data Analysis.
If you are unable to locate Data Analysis in Excel, then you need to install the Analysis ToolPak. This process is relatively easy: Go to FILE -> Options -> Add-Ins -> Analysis ToolPak -> Go -> Check Analysis ToolPak -> OK
Select Data Analysis and click on Regression.
Choose the Y Input Range and X Input Range
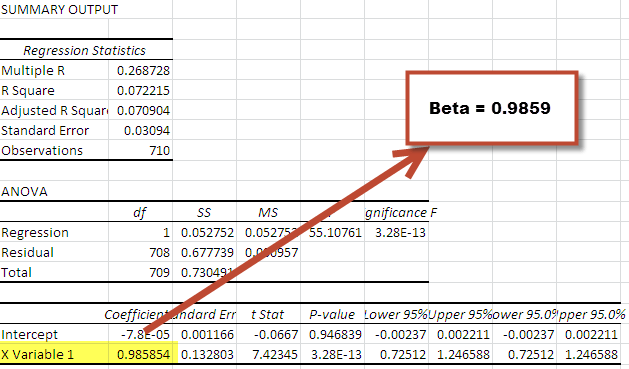
Once you click OK, you get the following Summary Output
As noted above, you get the same answer of Beta (Beta Coefficient) in each of the methods.
Also, note that MakeMyTrip beta is approximately closer to 1.0, this implies that MakeMyTrip stock prices have the same level of risk as to the broad NASDAQ Index.
Levered vs. Unlevered Beta
Levered Beta or Equity Beta is the Beta that contains the effect of capital structure, i.e., Debt and Equity both. The beta that we calculated above is the Levered Beta.
Unlevered Beta is the Beta after removing the effects of the capital structure. As seen above, once we remove the financial leverage effect, we will be able to calculate Unlevered Beta.
Unlevered Beta can be calculated using the following formula -
Beta (Unlevered) = Beta (levered)/ (1+ (1-tax) * (Debt/Equity))
As an example, let us find out the Unlevered Beta for MakeMyTrip.
Debt to Equity Ratio (MakeMyTrip) = 0.27
Tax Rate = 30% (assumed)
Beta (levered) = 0.9859 (from above)
Beta (Unlevered) = 0.9859 / (1+ (1-30) * 0.27)
Beta (Unlevered) = 0.8291
Calculate Beta of an Unlisted or Private Company
As seen earlier, Beta is a statistical measure of the variability of a company's stock price in relation to the stock market overall. However, when we evaluate private companies (not listed), then how we should find Beta? In this case, Beta does not exist; however, we can find an IMPLIED BETA from the comparable companies analysis.
Implied Beta is found using the following 3 step process -
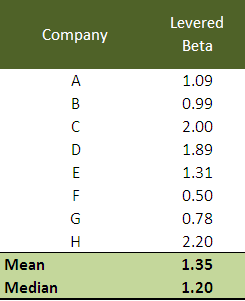
Step 1 - Find all the Listed Comparables whose Beta's are readily available.
Please note that the Betas that you download are Levered Betas, and hence, it is important to remove the effect of capital structure. The higher amount of debt implies higher variability in earnings (Financial Leverage), which in turn results in higher sensitivity to the stock prices.
Let us assume here that we want to find the Beta of a private company, let's call this as PRIVATE. As a first step, we find all the listed peers and identify their Betas (levered)
Step 2 - Unlever the Betas
We will use the formula discussed above to Unlever the Beta.
Beta (Unlevered) = Beta (levered)/ (1+ (1-tax) * (Debt/Equity))
Please note that for each of the competitors, you will have to find additional information like Debt to Equity and Tax Rates. While unlevering, we will be able to remove the effect of financial leverage.

Step 3: Relever the Beta
We then relever the beta at an optimal capital structure of the PRIVATE company as defined by industry parameters or management expectations. In this case, ABC company is assumed to have a Debt/Equity of 0.25x and a Tax Rate of 30%.
The calculation for the relevered beta is as follows:

It is this relevered Beta that is used for calculating the Cost of Equity of the Private companies.
What Does a Negative Beta Mean?
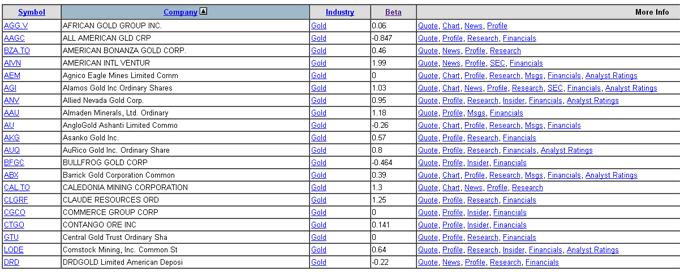
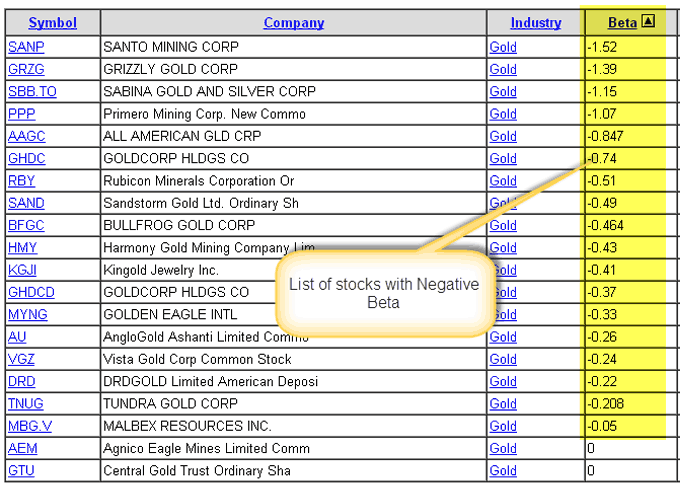
Though in the above cases, we saw that Beta was greater than zero; however, there may be stocks that have negative betas. Theoretically, the negative beta would mean that the stock moves in the opposite direction of the overall stock market. Though these stocks are rate, they do exist. Many companies that are into gold investing can have negative betas because gold and stock markets move in the opposite direction. International companies may also have negative beta as their business may not be directly linked to the domestic economy.
If you are curious to see some examples of Negative Beta Stocks, here is the process through which you can hunt for negative beta stocks.
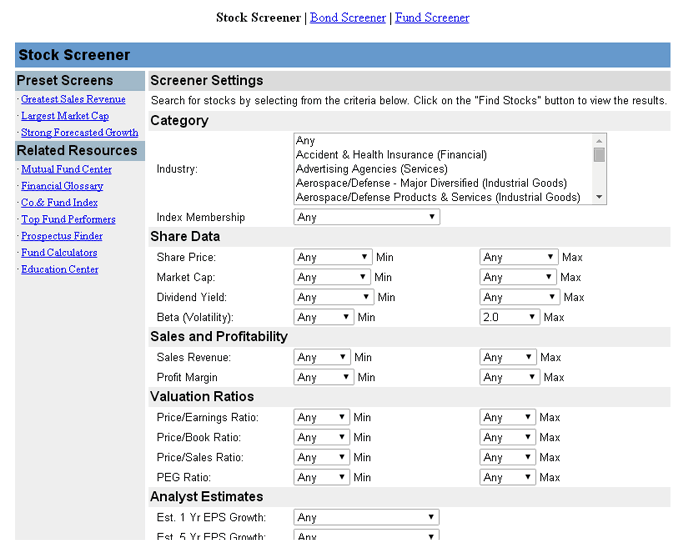
Step 1 - Visit Yahoo Screener
Step 2 - Choose the Industry Filter
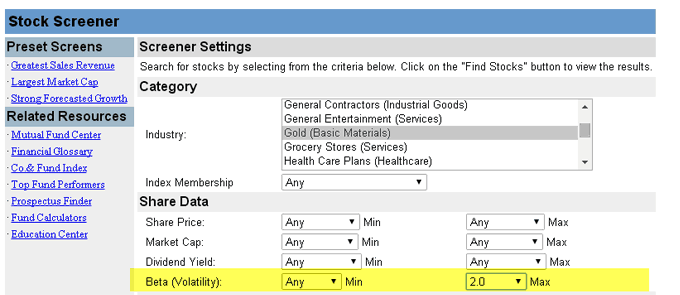
You may choose the sector/industry of your choice. I have picked up Gold (Basic Materials)
Step 3 - Choose the Beta Values Minimum and Maximum
Step 4 - Click on Find Stocks, and you will see the list below
Step 5 - Sort the Beta column from Low to High
Step 6 - Enjoy the list of Negative Betas :-)
Advantages of CAPM Beta
- Single measures to provide an understanding of security volatility as compared to the market. This understanding of stock volatility helps the portfolio manager with his decisions of adding or deleting this security from the portfolio.
- Most of the investors have diversified portfolios from which unsystematic risk has been eliminated. Beta only considers systematic risk, thereby providing the real picture of the risks involved.
Disadvantages of CAPM Beta
- "Past Performance is no guarantee of future" - This rule also applies on Beta. While we calculate beta, we take into account historical data - 1 year, 2 years or 5 years, etc. Using this historical beta may not hold true in the future.
- Cannot accurately measure Beta for new Stocks - As we saw from above that we can calculate beta of unlisted or private companies. However, the problem lies in finding the true comparable that can provide us with an implied Beta number. Unfortunately, we do not always have the right comparable for start-ups or private companies.
- Beta does not tell us whether the stock was more volatile during the bear phase or the bull phase. It does not distinguish between upswings or downswing movements.

