Table Of Contents
What Is The Capital Allocation Line?
The capital allocation line, also referred to as the capital market line, is the graph used to measure the risk related to securities and defines the relationship(the combination of) between risky and risk-free assets. It is also known as a reward to variability ratio. The line on the graph represents it.
It helps the investor choose the right combination of risky and risk-free assets, considering the investor’s risk appetite, and identifies the maximum return for that particular level of risk.
- Every investor wishes to earn maximum returns at minimal risk. While constructing their portfolio, every investor is faced with the issue of how much to allocate to the risky and risk-free assets.
- The aim is to optimize the return while keeping the risk at the lowest level.
- The capital allocation line helps investors determine this allocation percentage.
- It is used to identify the optimal mix of risky and risk-free returns, which results in maximum returns at minimal risk.
Key Takeaways
- The capital allocation line is a graph that illustrates the relationship between risky and safe assets.
- It is utilized to assess the risk associated with securities and is also referred to as the rewards-to-variability ratio. The line represents the trade-off between risk and return.
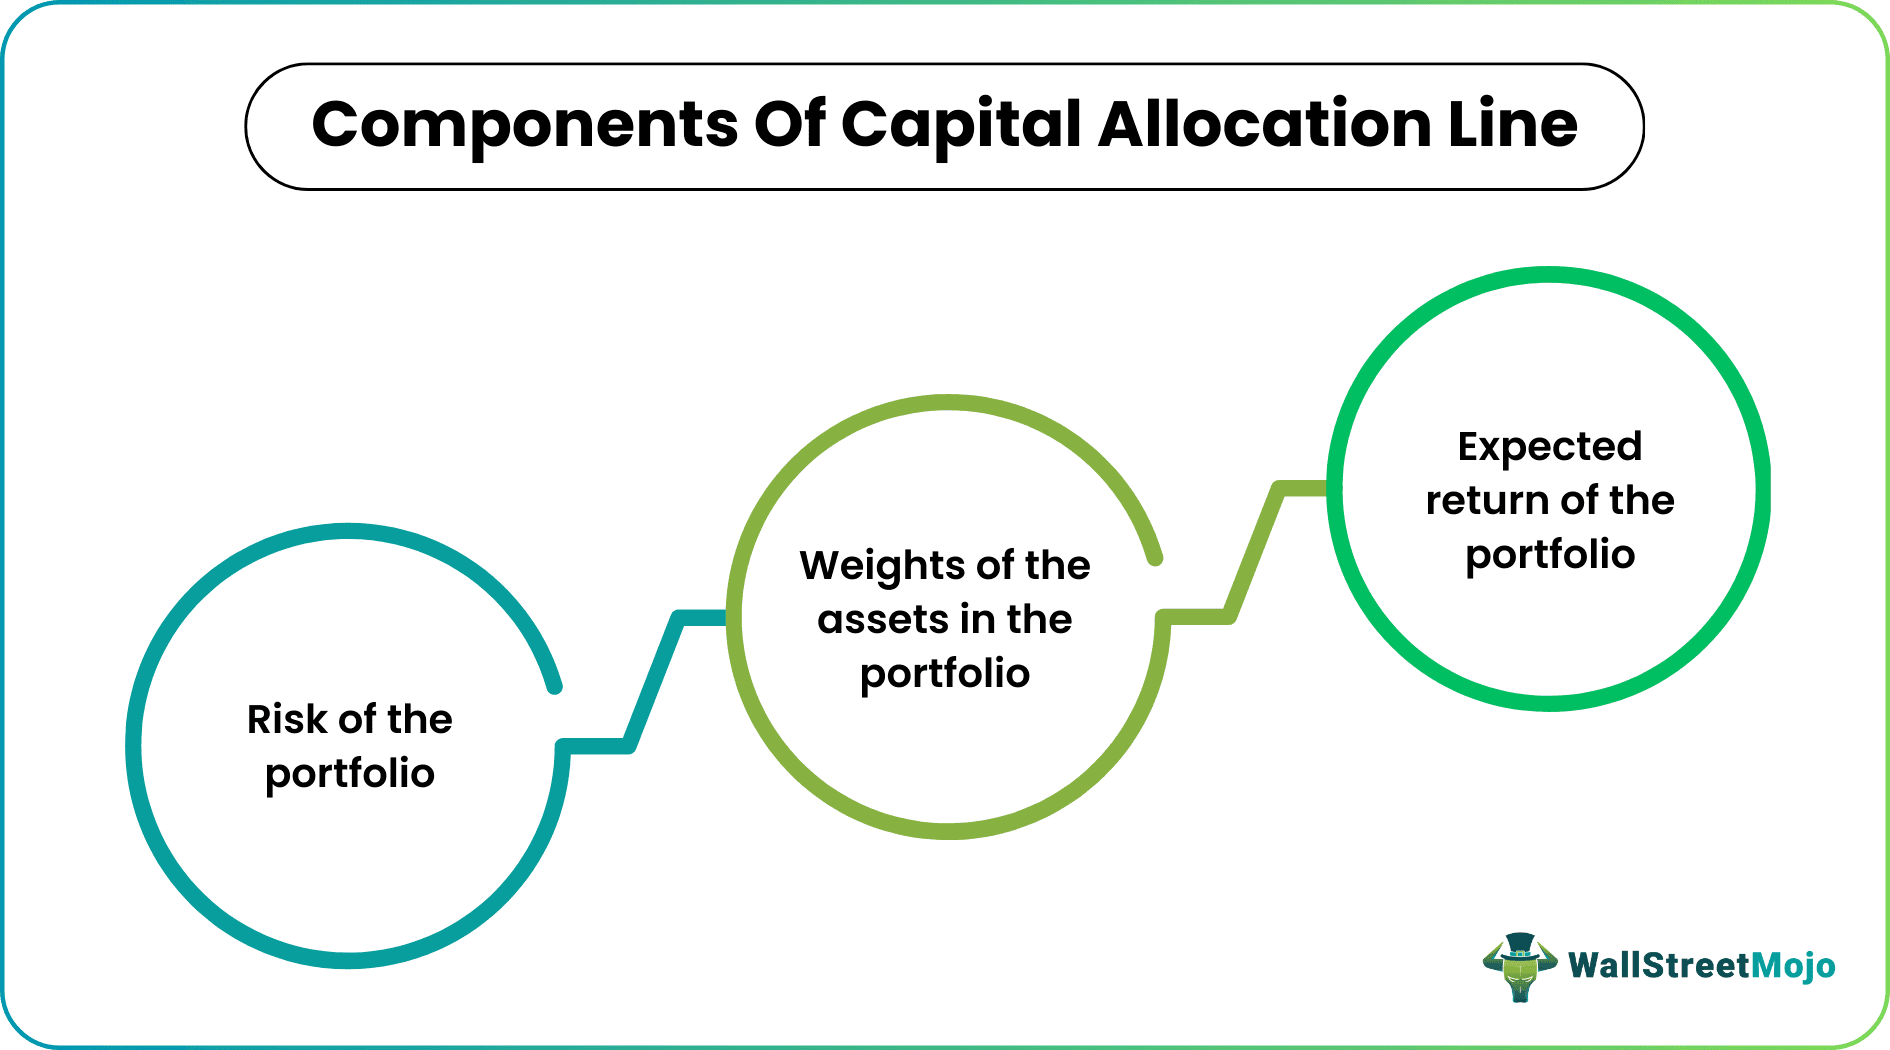
- The components of the capital allocation line include the risk of the portfolio, the weights of the assets in the portfolio, and the portfolio's expected return. These factors play a crucial role in determining the optimal balance of the portfolio.
Risky and Risk-Free Assets
Risk-free assets are those which do not contain any element of uncertainty as regards their return. It means that the return is guaranteed on those assets without default. These assets generally carry a lower interest rate, given their risk-free nature. Some examples of risk-free assets are-
- T Bills;
- Long Term Government Bonds;
- Deposits backed by Government;
- Treasury Notes
Alternatively, risky assets are those which contain a certain level of uncertainty as regards their return. When the uncertainty, i.e., the risk, is higher, the return promised on these assets is higher. Some examples of risky assets are –
- Private Equity
- Private Debt Market Instruments;
- Derivatives
- Options
- Real Estate
Components of Capital Allocation Line
The calculation of capital allocation takes into account the following components–

- Risk of the Portfolio – The portfolio's risk would be that of the risky asset concerning its weight in the portfolio. Risk-free assets, by definition, do not contain any risk, and therefore, the risk element would be zero.
- Weights of the Assets in the Portfolio – The different percentage mix in which the portfolio may be constructed using the risky and risk-free assets.
- Expected Return of the Portfolio – The portfolio's expected return is computed, taking into account the expected return of both the risky and risk-free assets while considering the volatility (i.e., riskiness) portfolio.
How to Calculate Capital Allocation Line?
Let us understand how the formula for the capital allocation line is determined. The return of a portfolio is calculated using the following formula –
Ep = E(rs) * w + (1-w) * E(rf)
where,
- Ep = Expected return of the portfolio
- E(rs) =Expected return of the risky asset
- W=Weight of the risky asset in the portfolio
- E(rf) =Expected return of the risk-free asset
Similarly, the risk of the portfolio is calculated with the following formula –
σp =σs * ws
Since the standard deviation (risk quotient) of a risk-free asset is zero, only the risky asset is considered to determine the risk of the portfolio.
Substituting the second formula in the first, we arrive at the following –
Ep = rf + * σp
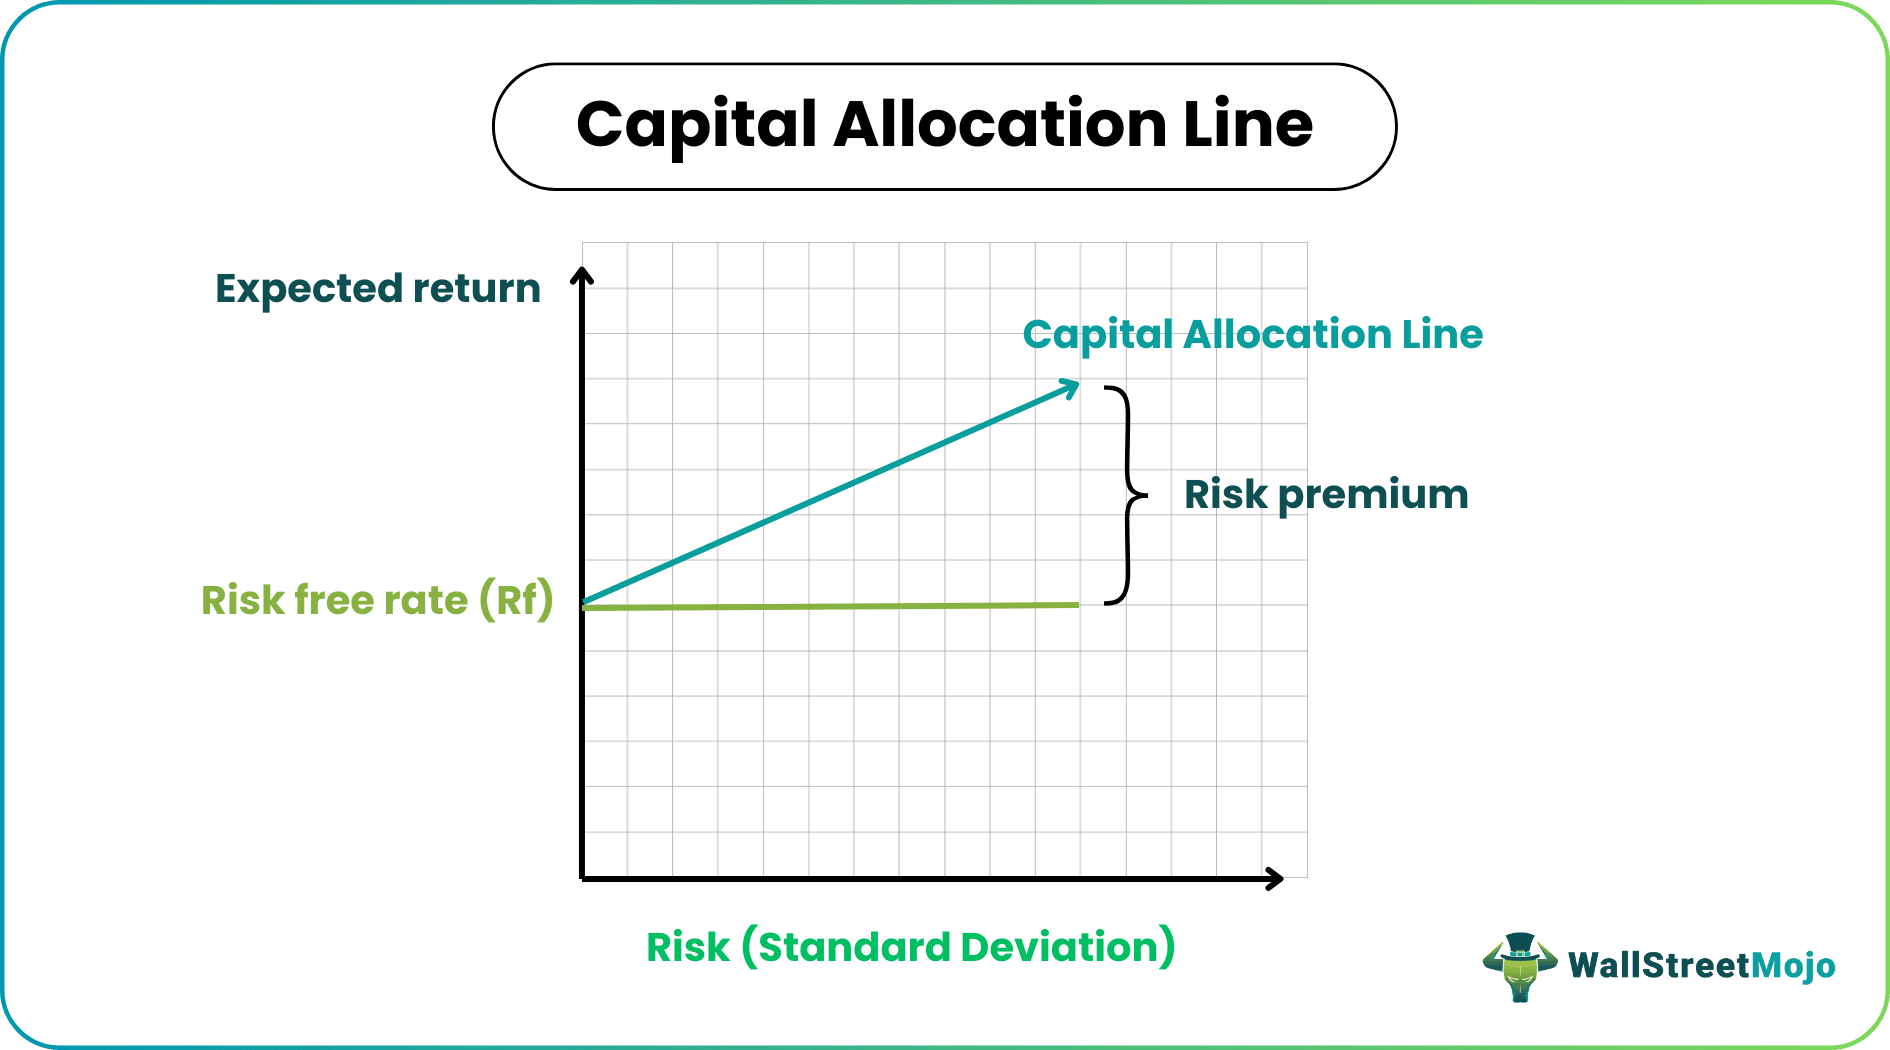
It is referred to as the formula for Capital Allocation Line. It can be denoted graphically as below –
The Capital Allocation Line denotes the expected return of a portfolio at varying levels of risk. The expected return is plotted along the y-axis, and the standard deviation (risk) is plotted along the x-axis. The excess return received for taking an additional risk is the risk premium – denoted in the graph.

Advantages Of Capital Allocation Line
- A portfolio is allocated optimally based on every investor’s risk appetite and objectives.
- No reliance is placed on whims or instincts. Instead, the percentages are calculated scientifically.
- It helps achieve maximum returns at minimal risk.
Limitations
- The calculation may not be easily understandable to the normal public. It requires specialization.
- The calculation relies on various information that may not be accessible to all the investors at large.

