Table of Contents
Candlestick Wicks Meaning
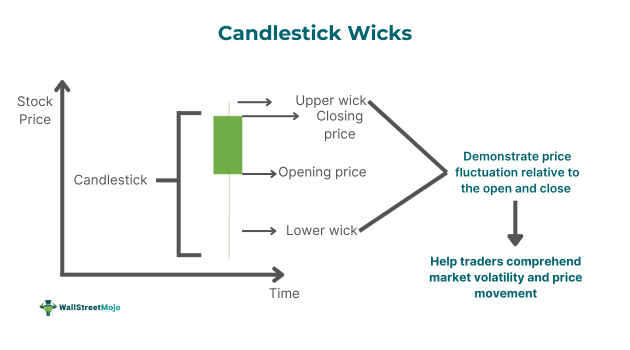
Candlestick wicks or shadows refer to lines found attached to candlesticks in a financial instrument’s price chart. These lines show an asset’s price fluctuation when compared to the opening price and the closing price and precisely demonstrate the lowest and highest prices at which an asset traded over a period.

A wick can be higher than a security’s closing price or lower than its opening price. In some cases, there might be only a lower or upper wick or no shadow. By observing a wick’s size, individuals may get an idea of the forthcoming trend and decide how to execute a trade to make financial gains.
Key Takeaways
- Candlestick wicks meaning refers to the lines found on the vertical portion of a candle’s either side in a price chart showing the high and low recorded in a period.
- These lines can enable traders to get an idea of the price movements and the associated volatility. Moreover, wicks offer crucial insights that one can use to make trading decisions.
- A key disadvantage of candlestick shadows is that they need to be combined with other technical analysis tools to make accurate predictions. On their own, they are often misleading.
How Do Candlestick Wicks Work?
Candlestick wicks meaning refers to a candlestick’s potions that depict price action outside the body of the candle. They provide key information to traders regarding a financial instrument’s performance by representing the high and low ranges. The top of an upper wick shows the high of a trading session, while the bottom of the lower wick represents the low. The vital insights.
If individuals are capable of reading candlestick wicks efficiently, they can make better buy and sell decisions. Moreover, they can comprehend the changes taking place in the market better and enhance their trading plans. This, in turn, would lead to higher profits.
How To Read?
The following pointers can help traders in reading candlestick wicks effectively:
- A long shadow below a candle’s body is a sign that the bears pushed the security’s price below, but the bulls regained control, driving the price up.
- If a long wick appears above a candle’s body, it suggests that bulls were in control and drove the price up, but before the period ended, the bears exerted significant selling pressure, pushing the price downward.
- A short wick on both sides is a sign that neither the buyers nor the sellers made any progress, as the price settled near the opening price at the end of the session.
- If a candle’s body is significantly shorter than the upper and lower wicks, it is an indication that both bears and bulls fought to push the price downward and upward, respectively. In this case, the candlestick represents indecisiveness. A popular example of such a candle is a doji.
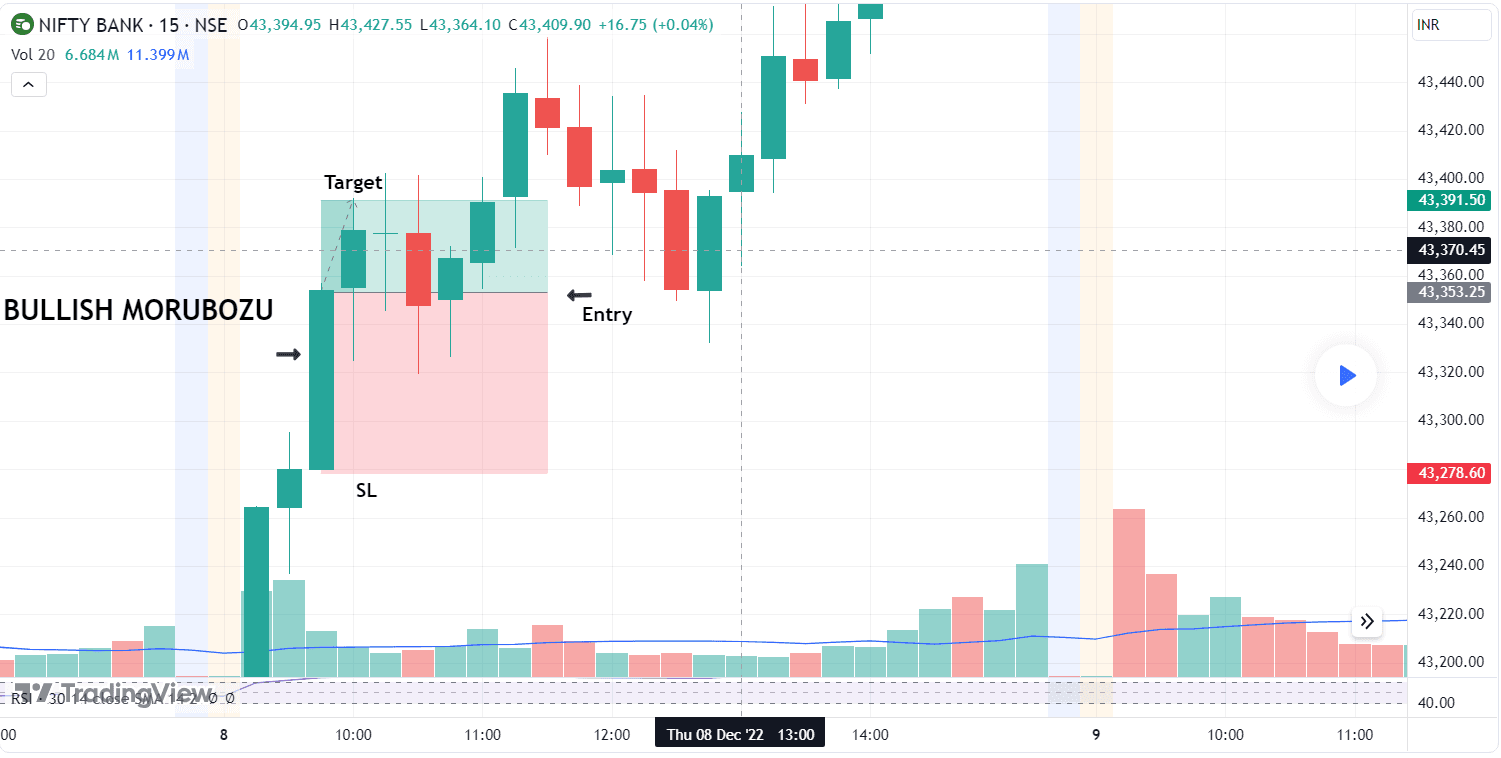
Let us look at the candlesticks in the TradingView price chart below to get a clear idea of candlestick wick interpretation.

In the Nifty Bank 15-minute chart above, at 10 am on Dec 8, 2022, we can see a bullish candle with a long lower wick and an upper wick shorter than the body. It indicates that the bears had exerted immense selling pressure, but soon, the buyers recovered and drove the price upward before the price settled around 20 points above the opening open.
Then again, at 11:30 am, we can observe a bearish candle with a long upper wick and a shorter lower wick. It indicates that the bulls had driven the price upward significantly, but the bears soon gained control, and as a result, the price dropped below the open and closed around 43,421.
The candlestick formed at 12 noon is a doji candle. One can identify it easily by the short body and long wicks. The wicks show that the opening and closing prices were close, and there was indecision among market participants.
Lastly, one can find the Marubozu candle with little to no wick. It is a sign that the price primarily traded between the opening and closing prices. This is an indication of a strong bullish sentiment in the market.
Examples
Let us look at a few candlestick wicks examples to understand the concept better.
Example #1
Suppose David is an equity trader who has been tracking Stock ABC for a month. The security has been in a downtrend for the past weeks. While observing XYZ’s candlestick chart, he notices a large bullish candlestick with a long lower wick near the support level after four bearish candles.
Along with the bullish candle, he identifies a significant rise in trading volume. Hence, he predicts that an uptrend is on the horizon and purchases 20 shares of XYZ at $10 per unit, placing a take profit order at $20. His strategy turned out to be accurate, as he earned a total profit of $200 after the specified price level was reached within 4 days.
Example #2
On March 28, 2024, Nifty closed 203 points higher, leading to the formation of a bullish candle featuring a long upper on the candlestick chart. This reflected selling pressure from the bears near the index’s all-time highs around the 22,500 mark. According to technical and derivatives analyst Nagaraj Shetti, the near-term upward trend of the index remained intact with volatility. The next upside levels to be watched were around 22,500 to 22,600 in the following week.
How To Trade?
One should keep the following pointers in mind for effective candlestick wicks trading:
- As noted above, in the case of a short or no wick, it is a sign of strong bullish or bearish sentiment. So, if the candle is a green candle, individuals might want to place a buy order. On the other hand, individuals might consider placing a sell order if the candle is bearish or red.
- The next strategy for candlestick wicks trading involves putting the focus on extended shadows during trend pullbacks. To determine the entry point, a trader closely looks for the formation of a long wick when the asset price starts pulling back. Indicating that the previous trend momentum might be regaining strength, 15-minute, - 30-minute, or 1-hour charts usually could be quite useful for a swing trader to spot the formation of a long shadow and implement this strategy.
- Traders can use long wicks to identify strong levels of support or resistance. They can spot price levels at which a reversal might materialize and accordingly execute their trades. One must note that while long wicks indicate strong support and resistance, short wicks signal weak support and resistance.
When using these strategies, one must ensure to use of multiple technical analysis tools, like stock chart patterns and oscillators, to predict future prices more accurately. Also, they must consider using take profit and stop loss orders to secure their financial gains and limit the potential loss.
For professional-grade stock and crypto charts, we recommend TradingView – one of the most trusted platforms among traders.
Disclosure: This article contains affiliate links. If you sign up through these links, we may earn a small commission at no extra cost to you.
Advantages And Disadvantages
Advantages
- These wicks help traders understand volatility and price movement, thus allowing them to make better trading decisions.
- Wicks enable traders to understand the market sentiment.
- Candlestick shadows aid in trend analysis as traders can utilize them to gauge the direction of trends.
- They give a clear picture of the range within which the price fluctuations take place.
Disadvantages
- Wicks, on their own, usually provide traders and analysts with limited information concerning the direction of the market.
- Trading candlestick wicks can only be useful for technical analysts as they do not factor in company-related news, economic or regulatory changes, etc.
- Candlestick shadows aid in trend analysis as traders can utilize them to gauge the direction of trends. Wicks can be misleading. Hence, once one must note solely rely on them when trading.

