Table Of Contents
What is Calmar Ratio?
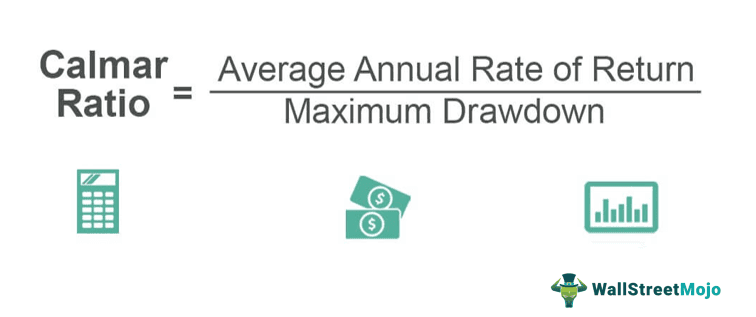
Calmar ratio refer to ratio of average annual rate to return to risk related to hedge funds and investments as it shows the relationship between return and risk and it is calculated by average annual rate of return divided by maximum drawdown for previous three years which is used to evaluate the performance of different hedge funds and to take decisions relating to investment. It was invented by Mr. Terry W. young in 1991 in the United States and is the short form for the company of Terry Young named “ California Management Account Reports”.

Formula
Calmar Ratio is more used in selecting a mutual fund or a hedge fund to evaluate the performance of the two and make a decision on the investment.
Calmar Ratio = Average Annual Rate of Return / Maximum Drawdown.
*Here, both the numerator and denominator are calculated for the past three years.
Examples
Example #1
Suppose A hedge fund has an annual rate of return for the past 3 yrs is 25%. The fund started its activity with $10,000, which rose to $25,000 and then dropped to $8,000 due to crises.
Solution:
Here the maximum drawdown needs to be computed for the fund in the following way:
Maximum Drawdown = ($25,000-$8,000)/ $25,000 = 68%.
Based on the above information, we can calculate the Calmar Ratio as below:

= 25%/68%
Calmor Ratio = 0.3676.
Example #2
Suppose there are two Funds, Fund A and Fund B. Below are the details of each fund. Which fund would be more beneficial for the investor to invest.
| Fund | Avg Annual Return | Max Drawdown |
|---|---|---|
| Fund A | 25% | 68% |
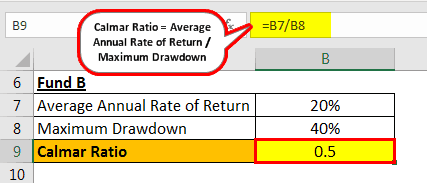
| Fund B | 20% | 40% |
Solution :
The Calmar Ratio of Fund A can be calculated using the above formula as,

= 25%/68%
Calmar Ratio of Fund A =0.37
The Calmar Ratio of Fund B can be calculated using the above formula as,

=20% / 40%
Calmar Ratio of Fund B =0.5
In the above example, an investor would be tempted to go for fund A, since it gives a higher annualized rate of return as compared to fund B. however if we compared the ratio of both the funds, the Calmar ratio of fund b is higher as compared to fund A. Hence fund A is riskier than fund B since it is more exposed to fluctuations in the NAV.
Advantages
It is one of the essential Ratios used by the Analyst and the Fund Managers to ascertain the performance of the Fund and compare the same with its peers who are giving high Returns. Below mentioned are some of the significant advantages:
- It provides a clear picture on the risk and returns relationship in the fund to the investors to invest their money cautiously.
- It highlights the level of fluctuations or variations in the prices periodically giving a clear picture of the price stability of the fund.
- The higher the ratio, the more performing the fund and the lower the Calmar ratio, less performing the fund, and more prone to deviations or fluctuations.
- It gives the fund manager an understanding of the fund performance and a signal about the funds with a low Calmar ratio and needs to be monitored further.
- It gives an investor a guide in selecting their investment strategy as it also considers the drawdown that has happened in the past three years.
Disadvantages
- It considers maximum drawdown instead of the standard deviation of the portfolio, which is a more relevant component in decision making.
- It is similar to the Sharpe ratio.
- It takes only a three year period to calculate the Calmar ratio.
- Most of the stocks are cyclical stocks that perform only in that particular period; hence, comparing their performance with the past three years would not be the right criteria.
- It is a mathematical tool and does not take into account the behavior of the Sector.
- It does not take into account the standard deviation of the stock or the fund.
- It does not take into account the future projections of the stock or the fund.
- It does not consider the new elements or the government policies ahead that will have a massive impact on the stock or the fund.
Points to Note about Change in Calmar Ratio
- A significant change in the Calmar ratio will suggest the ongoing performance of the fund and highlight the impact of the decisions taken in favor of or against the fund.
- A sudden rise in the Calmar ratio is a positive sign for the fund as the same is less prone to risk and deviations in the prices/nav and has started performing better.
- Alternatively, this implies the sudden fall in the Calmar ratio. It signifies that either the performance of the fund is affected due to the annual rate of return or the maximum drawdown over the past three years.
- As far as the investors are concerned, it would be better for them to stay away with the fund, which has experienced a sudden fall in the Calmar ratio. However, it may give higher returns and invest in the fund, which has shown a sudden increase in the Calmar ratio since the performance of the fund will now start improving in the long run.
Conclusion
Calmar Ratio is one of the essential tools to identify the correct fund to invest in for the investors and to monitor further the fund, which has a lower ratio from the fund managers’ point of view. However, other macro factors like govt policies, news elements, federal bank policies, and SEC regulations also need to be considered while deciding upon the fund performance instead of only considering the Calmar ratio for analysis and ignoring all other factors.
Finally, it is an excellent statistical tool to have a glimpse of the fund or the stock and its financial performance.

