Table of Contents
What Is Bullish Homing Pigeon?
Bullish homing pigeon is a candlestick arrangement that traders use in technical analysis to detect a bullish trend reversal of prices. There is a big red candle, followed by a small red candle fitting within the previous candle.
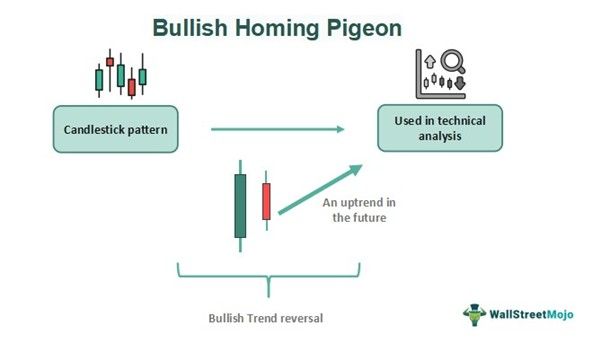
It signifies that the market will now show an uptrend because this pattern appears at the end of a downtrend. At this point, the sellers become weak, and buyers gain control. This two-day candlestick pattern is not suitable for fixing price targets, but it definitely signifies an uptrend.
Key Takeaways
- Bullish homing pigeon is a chart pattern where there are two candles; the first is a big bearish candle, and the second is a small bearish candle that fits into the first one.
- Traders use this pattern to identify upward reversal since it appears at the end of a downtrend.
- The candlesticks signify that the closing price is lower than the opening price, but sellers are losing their power, and buyers are gaining importance.
- The idea of a bullish uptrend is confirmed once the third candle is a green one.
Bullish Homing Pigeon Explained
The bullish homing pigeon is a positive trend reversal candlestick pattern that appears in the chart and is widely used in the financial market. Traders use it to identify a bullish reversal in prices, which means the market tends to go up in the near future.
This pattern is helpful in estimating the direction of price movement, and traders can plan their buy of entry points accordingly. It signifies that the selling pressure is weakening, and buyers are slowly taking control, pushing up the prices.
The bullish homing pigeon candlestick pattern is better confirmed once a green candle appears after it. This typically appears after or at the end of a downtrend, which is at the support level. It is a point where traders can also exit their short positions since the prices will move up in the near future.
This reversal candlestick pattern may also signify a continuation of the ranging market for a short period, after which it may go up. Therefore, it is necessary to wait for a bullish confirmation and not just depend on this candlestick arrangement. It should also be noted that other trend reversal indicators like MACD or RSI should be used to clarify changes in trends.
Confirmation Signal
The traders can obtain confirmation of the above pattern if they notice the situations mentioned in the chart below.
- The bullish homing pattern should appear at the end of a downtrend.
- After the pattern occurs, there should be a bullish green candle to confirm the possible uptrend in the future.
- It should be on or near the support level.
- If there is a bearish candle after the above pattern and if it closes below the close of the second candle, then there is every possibility that the price will go down further instead of moving up.
- Better confirmation is possible if it is used in combination with other technical indicators.
Formation
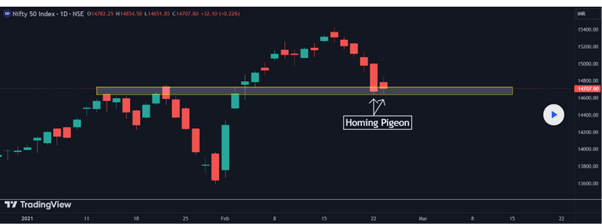
The formation of this candlestick arrangement can be explained better using a chart from TradingView, as given below. In the chart of Nifty 50 below, the particular candlestick pattern is pointed out. A big red bearish candle is visible, followed by a tiny red candle, which completely fits into the previous one. However, the small size of the second candle points out the fact that the selling pressure is reducing and buying will increase, pushing up the prices.
However, it is better to wait for a bullish candle to appear at the end of the pattern so that the possible uptrend is confirmed.
Stop Loss And Price Targets
In case the bullish homing pigeon candlestick pattern occurs, the trader has to wait and watch to ensure the direction of the price movement. If the price goes up, then it is a bullish pattern. In such a case, the trader may take a long position or buy the financial instrument under the anticipation that a rise in price will earn profits in the future.
However, placing a stop loss while they take the trade is very important since the market may also move opposite to the anticipated direction. Stop loss can be placed just below the lowest level of the pattern or at the lowest level of the second candle, depending on the trader’s risk appetite.
Here, it is also necessary to understand that this pattern does not provide any idea about the price target or the level at which the trader can anticipate to book profit and sell off the asset. The price may suddenly go up to a high level after the pattern appears in the chart, or the prices may hardly show any improvement. Therefore, they can fix a target price depending on the risk-reward ratio.
In case the price shows a fall or a downtrend, instead of going up, then the trader should place a stop loss at the top of the second candle and take a short position to earn profit.
Examples
Here are some suitable examples to understand the concept.
Example #1
Max is a long-term investor who is planning to invest in the stock of XYZ Green Energy since it has good prospects in the green energy field and has already invested in some profitable projects related to the same. However, the stock has been in a downtrend and then a consolidation phase for the last two years. But their investments have created a positive market sentiment, due to which Max feels the price will show an uptrend very soon. Within one week of the positive market news about the company, there is a bullish homing pigeon in the chart, following which the stock moves up after two trading sessions. Max puts a stop loss just below the second candle and takes a long position on the stock.
Example #2
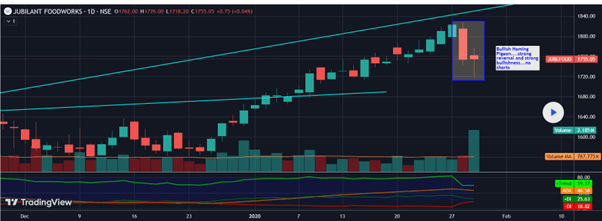
In the chart of Jubilant FoodWorks Ltd, given below, the pattern is visible within a highlighted box. There is a red bearish candle followed by a small red candle almost within the previous one, even though its closing is below the closing of the first candle. The pattern stands on a support level, which is an important consideration when locating this pattern within a chart. There is a strong possibility of an uptrend in the near future, but traders should wait for a confirmation in the form of a green candle before taking a long position.
Importance
Given below are some points of importance:
- This pattern indicates a trend reversal, which helps traders make decisions about trade.
- It typically shows a bullish trend for the future, based on which it is possible to make buy decisions after deciding on the entry point.
- Stop-loss levels are identified that protect traders in case the market does not go in the anticipated direction.
- It can be used in any charting platform and may appear in any time frame.
- It is a pattern that traders can quickly identify and use.
- It is also possible to take short positions in the market using this pattern in case the prices move down.
Bullish Homing Pigeon Vs Bullish Harami
Both the above are trend reversal patterns commonly used in technical analysis. But there are some differences as follows:
- The former is formed when a small red candle follows a big red candle. The latter is formed when a small green candle follows a big red candle.
- In the former, the second red candle may be within the previous candle, but in the latter, the second green candle will be within the first red candle.
Thus, the above are some essential differences between the two types of candlesticks.
For professional-grade stock and crypto charts, we recommend TradingView – one of the most trusted platforms among traders.
Disclosure: This article contains affiliate links. If you sign up through these links, we may earn a small commission at no extra cost to you.