Table Of Contents
Bullish Engulfing Pattern Meaning
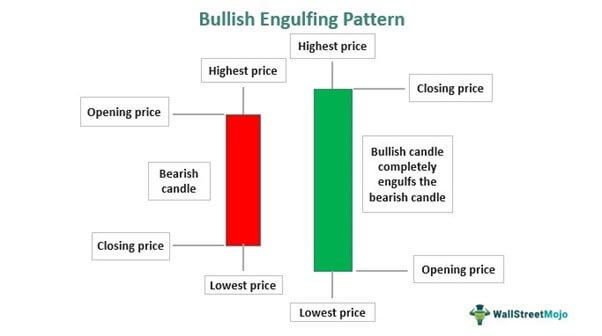
A bullish engulfing pattern appears when a large green candle appears after a small red candle of the previous day. The former’s body entirely overlaps or engulfs the latter’s body. Typically, it forms at the end of an established downtrend and often signals a trend reversal.
This two-candlestick pattern indicates that the bears or sellers pushed the financial asset’s price lower in the green candle. However, in the same trading session, the bears lost strength, and the bulls managed to take complete control, driving up the price above the red candle’s high. A bullish engulfing pattern confirmation helps traders identify attractive entry levels.
Table of contents
- Bullish Engulfing Pattern Meaning
- The bullish engulfing pattern refers to the formation of two candles in a downtrend; the second (bullish) candle completely overlaps the previous (red) candle’s body.
- Analysts interpret the formation of this pattern as a potential bullish reversal.
- When the candles appearing after the green candle have a higher closing price or if the red candle is a doji, the chance of a trend reversal is extremely high.
- The bullish engulfing pattern confirmation helps individuals spot attractive entry points that can generate significant financial gains.
Bullish Engulfing Pattern Explained
A bullish engulfing pattern is the most commonly used and easy to interpret form of candlestick pattern that analysts and investors can use to detect the possibility of upward movement of the stock market in future. It is a signal that denotes the potential reversal of trend from down to up, which the traders can use to make profits.
This bullish engulfing pattern chartink, along with other supportive trends that indicate an upward movement too, then it can be taken as a confirmation successfully. Therefore, it is not to be used as a standalone indicator but along with other patterns which give the same indication.
The bullish engulfing pattern means a two-candlestick pattern, where the second (green) candle’s body completely engulfs the first (red) candle’s real body. In other words, the green candle closes above the red candle’s opening price after opening lower than the latter’s closing price. It signals a potential reversal of investor sentiments, suggesting that a financial asset’s price might move upwards shortly after reaching the minimum value over a certain duration.
For a bullish engulfing pattern entry, the second candle signified a day when immense selling pressure was in the morning. Nevertheless, later on, the bulls decisively took over, pushing the price past the previous day’s opening price before the market’s closing bell.
Traders can get strong signals of a potential bullish reversal when the red candlestick is a doji candle or when the candles that form after the two-candlestick pattern close above the green candle’s high.
How To Find?
It is necessary for the traders to be able to easily identify the bullish engulfing pattern chartink properly, for which they should know how the patter looks like.
- The arrangement and color of the candle is clearly explained in the above section.
- Next comes the direction determination. Here, in most cases, the trader will assume that the market is suppose to move downwards. But, this pattern has now created the stage for a bullish movement or reversal. Overall, since the second green candle completely engulfs the first red candle, it provides a confirmation that the bulls have overpowered the bears and the buying pressure is more than the selling pressure, from the market psychology point of view. Here the shadow’s length does not matter.
- Now let us learn the other indicators that will help us to spot this candle arrangement:
- A trader may notice that a large number and volume of trades are happening in the market. Also, the number of buy trades are more than the sale.
- They should also take note of the fact that the downward price movement has been continuing for quite a long time. Therefore, now there may arise a possibility of an upmove since same trend will not continue forever.
- The other indicators like Relative Strength Index(RSI), the Stochastic Oscillator and also the Moving Average Convergence Divergence(MACD) should also show an upward trend, in support of the bullish engulfing concept.
Thus, the trader should check all the above and along with that, look for the stocks with bullish engulfing pattern. There is a huge chance of finding it.
How To Trade?
A trader’s response after spotting a bullish engulfing candlestick pattern depends on their position in a financial asset. Since a bullish engulfing candlestick pattern appears after a downward price trend, many traders take a short position when the bears are in control. However, traders must choose a different strategy as a trend reversal materializes.
The bullish engulfing candlestick pattern encourages traders to hold a long position. In other words, traders must buy the security and hold it in their portfolio until they can sell it at a higher price to make financial gains. Note that traders can make maximum financial gains with stocks with bullish engulfing pattern if they buy the security at its lowest intraday price on the candle’s second day.
That said, there are typically three main situations wherein a trader may buy a financial asset using this pattern. So, let us look at them.
- Individuals may buy a stock when its price surges from the gap down on the second day. However, the rally in price could represent a reversal of market sentiment per traders’ interpretation if the volume increased significantly along with the stock price.
- A trader might want to purchase a financial asset a day after the two-candlestick pattern appears on the chart. One chooses to wait for a day to confirm the bullish reversal.
- Individuals might choose to wait for another signal after this pattern formation. This sign is primarily a price break on the downward resistance line.
It is possible to understand the concept with the help of a chart from TradingView, which shows the pattern clearly. In the chart of Mafatlal Industries, given below, the last candle at the end of the chart as on 26th December 2022 is a good example of Bullish engulfing pattern. The green bullish candle completely engulfs the previous red bearish candle, signifying a possibility of upmove or uptrend in the near future. It is more effective if it forms at the end of a downtrend, as is in this case. It is better to wait for the next day and watch for a positive and bullish candle appearing in the chart, to ensure the uptrend. However, the trader should also consider changes in volume in this case. If along with the bullish pattern, there is considerable volume to support it, then it is a positive indication. But it is always better to use it in combination with other indicators to get a proper confirmation.
Examples
Let us look at a few bullish engulfing pattern examples to understand the concept better.
Example #1
After rejection at $43,000 on April 21, Bitcoin price plunged to $37,386 on May 1, 2022. On May 5, a bullish engulfing candlestick appeared on the cryptocurrency’s candlestick chart as the price briefly increased above the $40,000 mark. However, a trend reversal failed to materialize, and the price moved downward. This shows that the appearance of this pattern does not confirm a bullish reversal. Traders must remember this before taking a position in a financial asset.
Example #2
Let us say that Paul was observing DBC stock’s candlestick chart to look for an entry point. The stock’s price had been falling for the past two weeks. He identified a bullish engulfing candlestick pattern in a downtrend. He waited a day to see if the price would continue rising. The next day, he saw that the bulls were in control. Hence, he purchased 500 shares of DBC at $10 per unit.
The stock's price jumped further, and it was clear to him that the two-candlestick pattern at the bottom of the downtrend triggered the bullish reversal. Shortly after, He sold the stock at $13 per share and made a profit of $1,500.
In the above two examples, we notice how this particular indicator has been used for bullish engulfing pattern entry and how it gives a confirmation that the market is in the process of moving upwards and traders should take advantage of this situation to make profits.
However, it takes a lot of patience and clear understanding of the market. Trades should not rush into it with the hope of good return but wait till the indicators give good confidence levels regarding the next step. In this context, years of experience and of course some amount of mistake helps in making confident decision that guides the investor towards a good trade.
Bullish Engulfing Pattern Vs Piercing Pattern
A bullish engulfing is similar to a piercing pattern; it signals a potential bullish reversal. However, there are a few differences.
- In the case of the former, the green candle completely engulfs the red candle. On the other hand, in the case of a piercing pattern, the green candle partially engulfs the red candle. The overlap is between 50% and below 100%.
- From the above point, we notice that for the former, the opening price on the second day is lower than the support of the previous day, and the closing price is above the resistance of the previous day's close. But in the case of the latter, even though the opening price on the second day is lower than the support of the previous day, the closing price is not able to go higher than the resistance of the previous day, resulting in a partially engulfing green candle.
- For the former, the market psychology is that even though the sellers started selling and bringing the price down at the beginning of the day, the buyers strongly took over and started buying strongly, taking the price above previous day’s resistance. So the buy signal or bulls are strong in this case. But for the latter, the bulls are not able to keep up their strength till the end of the day and results in partial buying strength. Therefore, the buying pressure is reduced by the day’s end.
Thus, even though the variation appears to be very minor, the underlying meaning or indication should be clearly understood before taking the trade.
Bullish Engulfing Patterns Vs Bearish Engulfing Patterns
Before trading financial securities using such indicators, individuals must know the crucial difference between bearish and bullish engulfing patterns.
- A bearish engulfing pattern is the opposite of its bullish counterpart. In the case of the bullish engulfing pattern chart, the first candle isred , and the second candle is green. But in case of the latter, the first is green and the second is red.
- The second green candle’s body entirely overlaps or engulfs the first red candle’s real body in case of the former. On the flip side, in the latter case, the second candle is red and completely engulfs the previous green candle.
- Individuals can spot a bearish engulfing pattern at the end of an uptrend, signaling a potential bearish reversal, unlike the bullish pattern. Hence, many traders take a short position in a financial asset after spotting a bearish engulfing pattern.
- Both the signals can be used as an exit strategy for the trader, depending on the position they have taken. The bullish engulfing pattern chart will act as an exit strategy if the trader is currently in a short position with the hope that the market will go down. If they do not exit at this point, then it will result in a huge loss because the price of the stock may increase, rendering buying as lower price as impossible. Similarly in case of the latter, if the trader is holding a long position or has already bought a stock, and wants to sell it, then it is better to do so at this point, so that a falling price of the stock and overall loss can be stopped.
Therefore, both the concepts are equally interesting and require a very clear and precise understanding of the price movement, both from the technical point of view and market psychology. Only then the strategies can be appropriately used.
For professional-grade stock and crypto charts, we recommend TradingView – one of the most trusted platforms among traders.
Disclosure: This article contains affiliate links. If you sign up through these links, we may earn a small commission at no extra cost to you.

Frequently Asked Questions (FAQs)
This pattern is extremely useful for traders when a financial asset, such as a stock or a commodity, is in a downtrend as it shows a shift in momentum, indicating a chance of making financial gains.
One should look for certain characteristics to spot this pattern on a candlestick chart. Let us take a look at them.
- A strong green candle, the body of which completely engulfs the prior red candle’s body
- The pattern usually appears at the end of a downtrend
The pattern is highly reliable as many traders use it to make financial gains. According to Thomas N. Bulkowski, it successfully signals a bullish reversal 63% of the time. On the other hand, bearish engulfing patterns indicate a bearish reversal 79% of the time. Hence, traders must seek stronger confirmation in the case of bullish engulfing candlestick patterns.
Recommended Articles
This has been a guide to Bullish Engulfing Pattern & its meaning. We explain the difference with bearish engulfing pattern, examples, how to trade. You may also find some useful articles here -
