Table Of Contents
What Is Bullish Continuation Pattern?
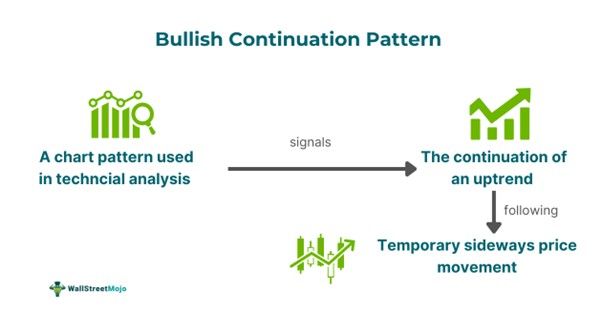
A bullish continuation pattern refers to a technical analysis chart pattern that suggests an uptrend will continue following a period of consolidation. One can use such a pattern to spot potential price trends and make buy and sell decisions that can lead to substantial financial gains.

One may identify this kind of pattern across different timeframes and asset classes. Some common types of bullish continuation patterns used for trading include bullish rectangles, ascending triangles, bullish pennants, and bull flags. These patterns provide insight into the behavior of market participants, helping traders figure out entry as well as exit points effectively and make well-informed decisions.
Key Takeaways
- Bullish continuation pattern meaning refers to a chart formation that indicates that an uptrend in a security’s price will continue once a short duration of consolidation is over.
- Such a pattern can be of different types, for example, bullish flag, ascending triangle, and bullish pennant.
- Unlike a bullish continuation chart formation, a bearish continuation chart pattern indicates the possibility of a downtrend continuing after a short period of sideways price movement.
- One can use a stop loss when trading such patterns to limit losses.
Bullish Continuation Pattern Explained
A bullish continuation pattern is a chart pattern that indicates that a financial instrument’s uptrend will resume following a brief period of consolidation. Traders can use this pattern to determine when to enter or exit a trade and manage risk effectively.
Simply put, such a pattern occurs in the middle of an upward or bullish trend and acts as a pause in a security’s price action. Bullish continuation patterns are complete only after the price breaks out following the pattern formation. One can find such patterns across all timeframes, as noted above. So, be it a daily, hourly, or weekly chart, the formation of this type of pattern can take place.
Typically, such a pattern is most reliable if the bullish trend that moves into it is strong and the trending waves are larger in comparison to the pattern itself. Significant moves against the uptrend and an absence of conviction concerning the trending direction are signals of a weak bullish continuation pattern.
Types
Let us look at some popular types of such a pattern:
#1 - Ascending Triangle
One can draw this pattern using the following two elements:
- An ascending trendline
- A horizontal line of resistance
The pattern indicates that the bulls are increasing their dominance, and a price breakout above the level of resistance is on the horizon.
#2 - Bullish Flag
The formation of this pattern occurs when a security’s price shows a sharp movement upwards (flag pole), succeeded by a brief period of consolidation (flag).
#3 - Bullish Pennant
In the case of this pattern, the price action is subject to consolidation within a couple of converging lines until the asset price breaks out.
#4 - Bullish Rectangle
One can draw this pattern using horizontal or parallel resistance and support lines. The pattern is complete once the financial instrument’s price breaks above the resistance line after a temporary consolidation period.
How To Identify?
Let us take the help of TradingView charts to understand how one can spot the above-mentioned bullish continuation chart patterns.
#1 - Bullish Rectangle
The following TradingView chart can help identify a bullish rectangle pattern.

As one can observe, two horizontal lines form the bullish rectangle pattern, and the price consolidates between those two lines. The pattern is complete once the price breaks out above the upper horizontal line in a trading session. The upward movement in price is accompanied by a significant increase in trading volume.
#2 - Bullish Pennant
The following Tata Motors price chart shows that bullish pennant pattern.

One can easily identify it by the sharp upward price movement, followed by price consolidation within the two converging lines. As we can observe, the pattern becomes complete as a breakout materializes above the upper line, and the uptrend resumes again.
#3 - Ascending Triangle
In the following DMart price chart, one can easily identify an ascending triangle drawn with the help of an ascending trend line and a horizontal resistance line.

One must note that the pattern is not complete yet, as the breakout above the resistance line has not materialized yet.
#4 - Bullish Flag
Let us observe the following Reliance Industries chart to understand how one can spot this pattern.

The black line passing through the sharp rise in price is the flag, while two lines within which the price consolidation takes place form the flag. In the chart, the bullish flag pattern is not complete, as the price did not break out above the flag.
How To Trade?
Let us find out how one can trade each of the patterns discussed above effectively.
#1 - Ascending Triangle
A popular strategy involves Individuals taking entry after the breakout to the upside occurs. They place a stop-loss order outside this pattern, below the ascending trendline.
#2 - Bull Flag
Individuals can trade this pattern by placing a buy order after a breakout occurs above the flag. To limit their potential losses, they can consider placing a stop-loss order just under the flag’s boundary.
#3 - Bullish Rectangle
In this case, traders must enter a long position or execute the buy order right after a breakout materializes above the pattern’s upper horizontal line. They should place a stop-loss order just below the pattern’s lower horizontal line.
#4 - Bullish Pennant
A common entry point in the case of this pattern is just above the resistance line just after the price breakout occurs. Traders can consider placing the stop-loss below the two lines’ intersection.
Note that individuals can set profit targets per their risk appetite to ensure that they can secure their gains.
Examples
Let us look at a few examples of bullish continuation patterns to understand the concept better.
Example #1
Suppose John is a stock trader who has been tracking the price movements of Stock ABC. He noticed a sharp price rise, signifying an uptrend, and then a period of consolidation followed. After close observation, he noticed the formation of an ascending triangle. To plan his next move and set potential entry and exit points, he drew the pattern. For that, John connected the higher lows, denoting the rising level of support, and he drew a horizontal line joining the swing highs, thus forming the level of resistance.
Once the drawing was complete, he waited for the breakout to materialize. Soon, the price breached the resistance level and began to surge upwards. He decided to enter the trade just above the line, joining the swing highs, and he placed a stop-loss order just below the ascending trendline. Also, he placed a profit target by measuring the size of the ascending triangle’s widest part. With this strategy, he made significant gains from the upside move.
Example #2
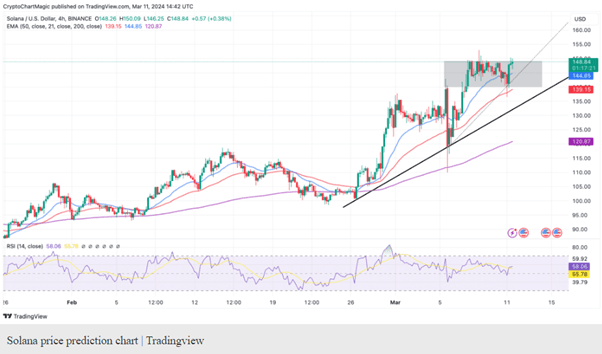
According to a report published on March 11, 2024, the Solana token hovered around $148 after a thrust for new highs of 2024 seemed to have encountered an obstacle at $150. There were indications of consolidation prior to the much-expected breakout toward the target of $200.

Per the above 4-hour chart, the token’s price was moving in a new pattern that exploded, touching new levels after a period of sideways movement ahead of a potential breakout. In the chart, a couple of key price levels are visible — the support and resistance levels at $140 and $150, respectively. The consolidation within the rectangle was a great opportunity for investors to accumulate more Solana tokens for gains over the long term.

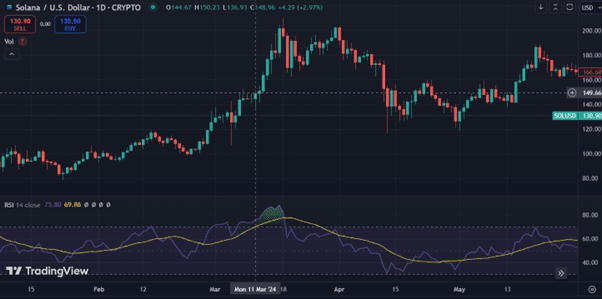
As one can observe in the above chart, a breakout indeed materialized as Solana went into an uptrend again later on, breaching the coveted $200 target.
Bullish Continuation Pattern vs Bearish Continuation Pattern
The key differences between bullish and bearish continuation patterns are as follows:
- In the case of a bullish continuation pattern, a downtrend precedes the consolidation phase. On the other hand, in the case of bearish continuation patterns, an uptrend precedes the period of consolidation.
- After the formation of a bullish continuation pattern is complete, the uptrend resumes. After the completion of a bearish continuation pattern, the downtrend resumes.
- The different kinds of bullish continuation patterns include bullish pennant, ascending triangle, and bullish rectangle. That said, the different types of bearish continuation patterns include bearish flags, bearish pennants, and discerning triangles.
For professional-grade stock and crypto charts, we recommend TradingView – one of the most trusted platforms among traders.
Disclosure: This article contains affiliate links. If you sign up through these links, we may earn a small commission at no extra cost to you.

