Table Of Contents
What Is A Bull Flag Pattern?
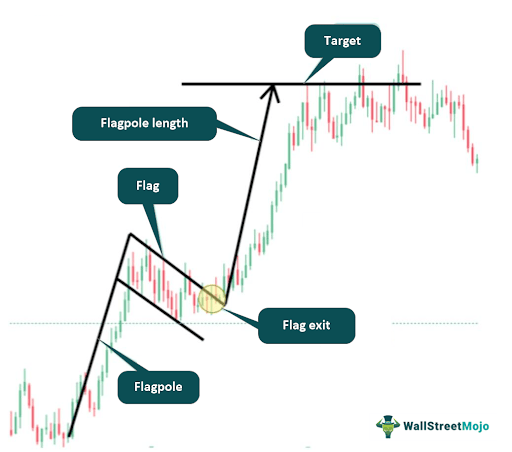
A Bull Flag Pattern is an analysis chart pattern that occurs within an uptrend and is considered a continuation pattern. Traders and investors use it to identify potential buying opportunities. The target for the bull flag pattern can be calculated by evaluating the length of the flagpole and projecting it upward from the breakout point.

The underlying asset will likely continue its uptrend after the consolidation phase. Traders typically watch for a breakout above the upper boundary of the flag (resistance) as a signal to enter a long (buy) position. The pattern's reliability increases when there is a noticeable decrease in trading volume during the flag formation, followed by a volume surge during the breakout.
Table of contents
- What Is A Bull Flag Pattern?
- The Bull Flag Pattern is a continuation pattern that occurs within an uptrend. The prevailing uptrend is likely to continue after a period of consolidation.
- The pattern consists of two main components: a flagpole (sharp price rise) and a flag (consolidation phase). The flagpole represents a significant surge in buying activity, while the flag is a period of rest or pause as the market catches its breath.
- Traders identify the Pattern by drawing trendlines to connect the low points of the flag consolidation phase. The upper boundary of the flag serves as potential resistance.
- The breakout trigger occurs when the price convincingly breaks out above the upper boundary of the flag. Traders often use this breakout to signal to enter long (buy) positions, anticipating the uptrend to resume.
Bull Flag Pattern Explained
The bull flag pattern is a graph pattern that appears when a stock or other financial asset is in an uptrend (prices are generally rising). It is called a "Bull" flag because it indicates optimism and potential for further price increases.
The origin of it can be traced back to technical analysis, a method of calculating markets based on historical price and volume data. Technical analysts have identified and named various chart patterns to help predict future price movements.
The term "Bull Flag" comes from finance and trading. The word "Bull" describes an optimistic market where prices are rising or expected to rise. In contrast, "Bear" describes a pessimistic market with falling or expected-to-fall prices. The term "Flag" is used because the pattern's shape resembles a flag on a flagpole, where the flag is a smaller, rectangular area that follows a sharp rise (the flagpole).
Traders and investors use the bull flag pattern and other technical analysis tools to decide when to enter or exit positions, helping them take advantage of potential price movements in the market.
Examples
Let us understand it better with the help of examples:
Example #1
Imagine a fictional tech company called "TechCo" that recently launched a revolutionary product, and its stock price has been on a solid uptrend. Over the past few weeks, the stock has seen significant buying interest due to positive reviews and robust sales numbers.
In our imaginary scenario, TechCo's stock price suddenly spiked from $100 to $150 in just a few days, representing the flagpole of the bull flag pattern. After the sharp rise, the price enters a consolidation phase, and the stock price moves in a narrow range between $140 and $145, forming the flag.
As traders and investors notice this pattern, they become increasingly optimistic about the stock's potential to continue its uptrend after the consolidation period. They start closely monitoring TechCo's inventory, waiting for a breakout above the upper boundary of the flag at $145. Once the breakout occurs, many traders may decide to buy the stock, anticipating further price increases.
Example #2
In the recent market analysis conducted in 2023, Bitcoin shows a potentially bullish setup, with technical analysts identifying a bull flag pattern on the price chart. This pattern is characterized by a sharp and rapid increase in Bitcoin's price, followed by a consolidation phase forming a flag. Analysts interpret the bull flag as a temporary pause in the uptrend, with potential for a continuation of the upward movement.
Based on the bull flag pattern, experts have projected a possible $35,000 rally ahead for Bitcoin. Traders must confirm the way with other technical indicators before making trading decisions. The breakout above the upper boundary of the flag is seen as a trigger to enter long positions, anticipating the uptrend's continuation.
Despite the promising setup, caution is advised due to the inherent risks in cryptocurrency trading. Proper risk management, such as employing stop-loss orders, is crucial to safeguard against unexpected market volatility.
How To Identify?
To identify the bull flag pattern on a price chart, follow these steps:
Step 1: Understand the Trend
Before looking for the bull flag pattern, one has to determine the overall trend of the asset they are analyzing. The pattern should occur within an uptrend, where prices are generally rising. If the purchase is in a downtrend or moving sideways, the bull flag Pattern is not applicable.
Step 2: Locate the Flagpole
Next, locate the flagpole, the sharp and rapid price increase during the uptrend. The flagpole represents a surge in buying activity.
Step 3: Draw the Flag
Once the flagpole is identified, draw a trendline connecting the low points of the price action during the consolidation phase after the flagpole. This trendline represents the lower boundary of the flag.
Step 4: Identify the Upper Boundary
Draw another trendline connecting the high points of the price action during the consolidation phase. This trendline represents the upper boundary of the flag.
Step 5: Confirm Volume Behavior
For additional confirmation, consider the trading volume during the consolidation phase. It should decrease as the flag pattern forms and increase again during the breakout.
Step 6: Look for a Breakout
After identifying the pattern, watch for a breakout above the upper boundary of the flag. A flight occurs when the price closes convincingly above the upper trendline. This breakout often signals that the uptrend will continue, and traders may consider entering long (buy) positions.
It is possible to understand the concept in more detail by analyzing a chart taken from TradingView, as given below for Reliance Industries. A flag is seen, formed with a clear pole and facing upwards, signifying a bulling trend. The poll shows how rapidly the price rose during the few trading sessions because the stock was in high demand, and there was considerable buying pressure.
Next, by joining the trendlines that connect the highs and the lows, the upper boundary and the lower boundary of the flag are complete. During this period, there is a consolidation phase for the stock, which is when the candles move within a range. There is little significant movement for the stock. In order to understand the price and market movement, tracking the volume is equally important. Traders should notice that during the period when the stock went up steadily, the volume bars show a significant surge. Therefore, the stocks were actively traded during that time, and there was mainly a lot of buying involved, pushing up the prices. The flag area shows that the volumes are significantly down, as compared to the pole region. At this point, the trader will have to wait for a breakout from the upper trend line, which will confirm the move. Only then can they decide on the trade with confirmation.

How To Trade?
Here's a step-by-step guide on how to trade the bull flag pattern:
Step 1: Identify the Pattern: Use technical analysis to identify a bull flag pattern on the price chart. Look for a sharp price rise (flagpole) followed by a period of consolidation forming a rectangular or parallelogram shape (the flag).
Step 2: Confirm the Pattern: Confirm the pattern with other technical indicators or analyses before making trading decisions. Check for decreasing trading volume during the flag formation and increasing importance during the breakout for additional confirmation.
Step 3: Set Entry Trigger: Define the entry trigger. In the case of the bull flag pattern, the entry trigger is a breakout above the upper boundary of the flag (resistance level). Traders often wait for the price to close above the flag's upper border convincingly before entering a long (buy) position.
Step 4: Set Stop-Loss Order: Determine your stop-loss level to manage potential losses. Place a stop-loss order just below the lower boundary of the flag (support level). If the price moves against your position and breaks below the flag's lower edge, the stop-loss order will automatically exit the trade to limit losses.
Step 5: Set Take-Profit Target: Establish a take-profit target to secure potential profits. Please measure the length of the flagpole (from the base to the high point) and project it upward from the breakout point.
Step 6: Risk Management: Practice proper risk management throughout the trade. Avoid risking more than a predefined percentage of your trading capital on any transaction. Managing risk is crucial to protect against unexpected market movements.
Step 7: Monitor and Adjust: After entering the trade, closely monitor price movements and stay updated on market conditions. Adjust your stop-loss and take-profit levels if necessary to respond to changing market dynamics.
Benefits & Risks
Some of the key benefits and risks of the bull flag pattern are as follows:
The benefits are as follows:
- Early Identification of Continuation: The pattern allows traders to identify the potential continuation of an existing uptrend. Getting in early on a continuing bullish trend can offer significant profit opportunities.
- Clear Entry and Exit Signals: The pattern provides precise entry and exit signals. Traders can enter a long (buy) position once the price breaks above the upper boundary of the flag, and they can use the lower boundary as a stop-loss level.
- Defined Price Targets: Traders can estimate price targets using the length of the flagpole, providing a potential guide for profit-taking and trade planning.
The risks are discussed below:
- False Breakouts: The pattern is not foolproof like any technical pattern. False breakouts result in potential losses if the price progresses in the opposite direction.
- Market Volatility: The pattern's effectiveness can be affected by sudden market volatility or unexpected news events, which may disrupt the anticipated price continuation.
- Subjectivity: Identifying the pattern requires subjective analysis, and different traders may interpret the pattern differently. This subjectivity can lead to varying trading decisions.
Bull Flag vs Bull Pennant vs Flat Top Breakout
The bull flag is a bullish continuation pattern seen through an uptrend. It consists of a flagpole (a sharp price increase) followed by a period of consolidation as a rectangle or parallelogram (the flag). Like the bull flag, the pull pennant is a bullish continuation pattern that appears during an uptrend. It features a small symmetrical triangle pattern (the pennant pattern) formed after a sharp price increase (flagpole). At the same time, the flat top breakout can be both a bullish continuation or reversal pattern. It occurs when the price consolidates in a horizontal rectangle after a strong uptrend.
Below is a comparison between bull flag, bull pennant, and flat top breakout chart patterns:
| Chart Pattern | Description | Formation | Breakout Trigger | Continuation Pattern? |
|---|---|---|---|---|
| Bull Flag | Bullish continuation pattern. | Flagpole (sharp rise) followed by a rectangular consolidation (flag) | Breakout above the upper boundary of the flag | Yes |
| Bull Pennant | Bullish continuation pattern. | A small symmetrical triangle pattern (pennant) after a sharp price increase (flagpole). | Breakout above the upper boundary of the pennant | Yes |
| Flat Top Breakout | Bullish continuation or reversal pattern. | A horizontal price consolidation (rectangle) after a strong uptrend. | Breakout above the upper boundary of the rectangle for continuation, below for reversal | Can be both |
For professional-grade stock and crypto charts, we recommend TradingView – one of the most trusted platforms among traders.
Disclosure: This article contains affiliate links. If you sign up through these links, we may earn a small commission at no extra cost to you.

Frequently Asked Questions (FAQs)
While it can be observed in various financial assets, it is essential to consider the characteristics and trading volume of the specific investment. Patterns in high-volume and liquid assets tend to be more reliable than those in low-volume or illiquid markets.
The duration of it can vary. The consolidation phase (the flag) can last from a few days to several weeks, depending on the analyzed chart.
· Traders should not depend solely on it for trading decisions. Combining it with other technical indicators, such as volume, moving averages, or support/resistance levels, can provide additional confirmation and improve the overall trading strategy.
