Table Of Contents
What Is Break Even Sales Formula?
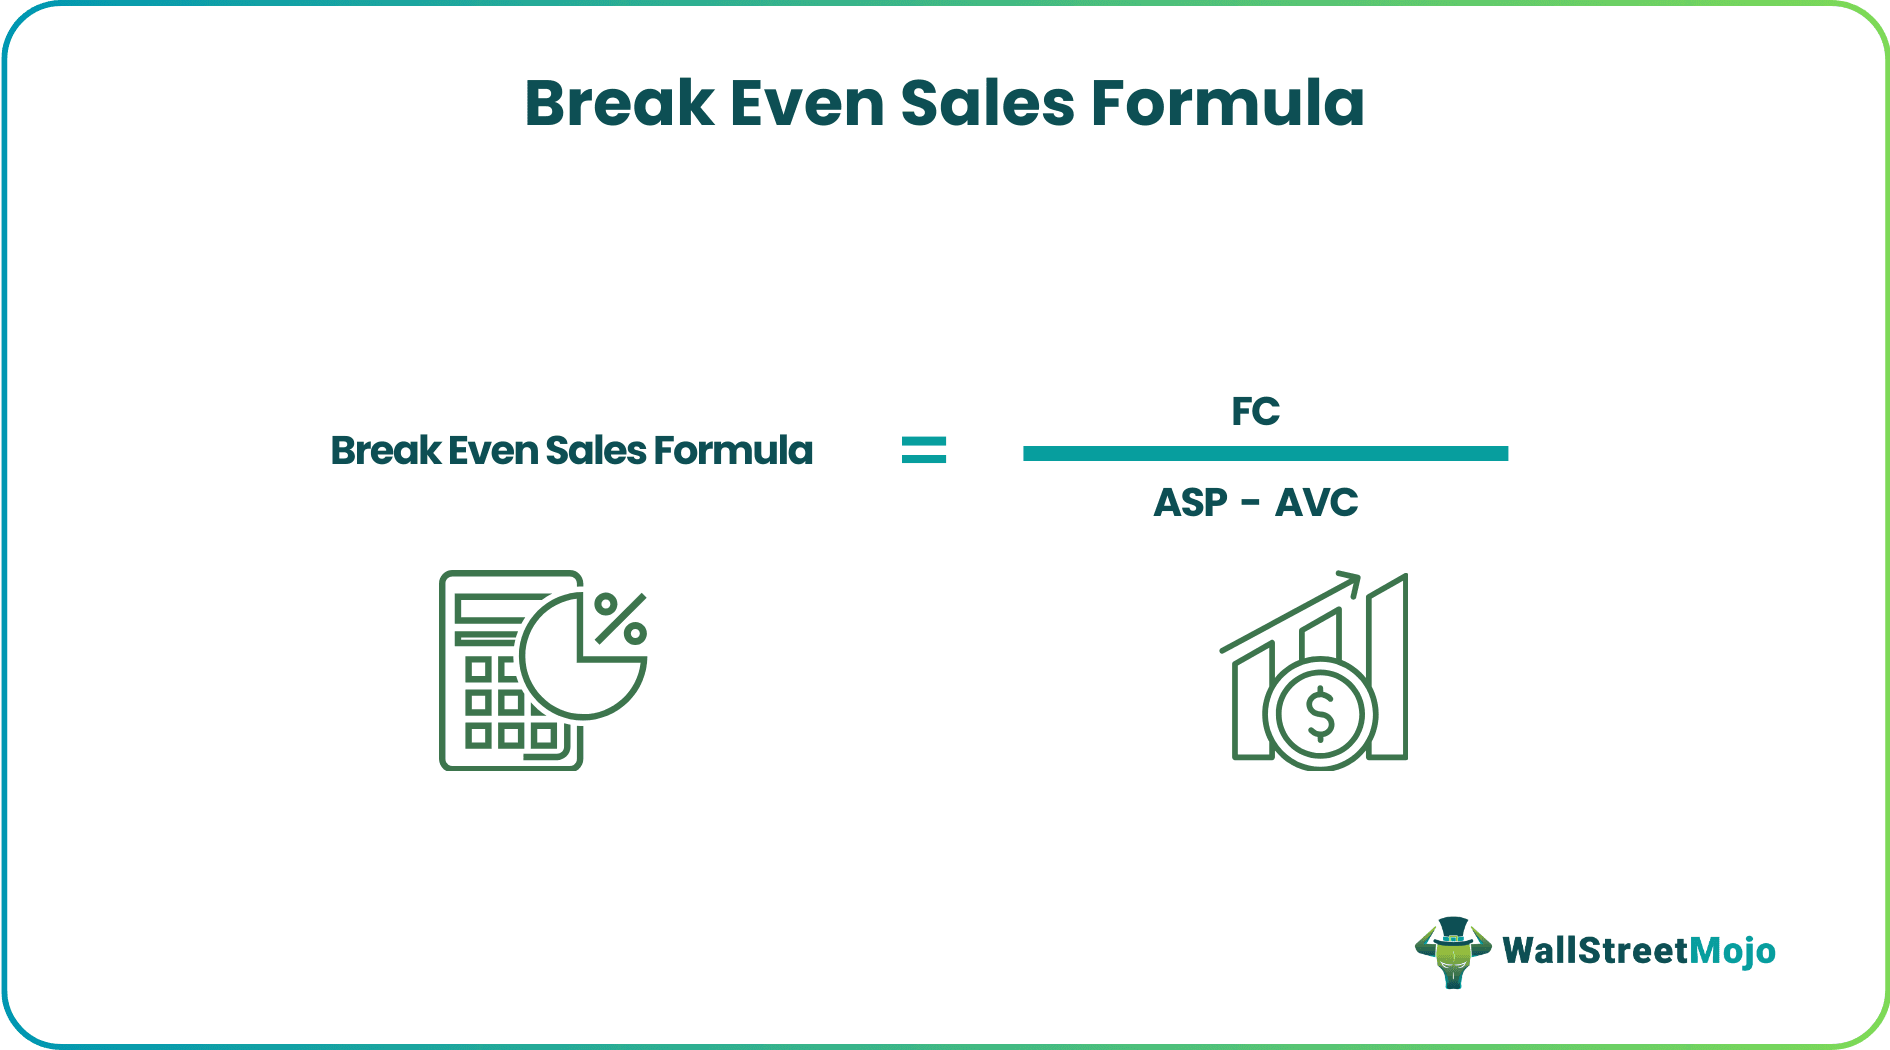
Break-Even Sales Formula refers to the expression used to calculate the total amount of the revenue level at which there is zero amount of the profit to the business and it is calculated by dividing the total fixed expenses of the company by the contribution margin percentage.

The figure obtained after the calculation takes into consideration the exact fixed as well as variable expenses. The expression helps manufacturing units assess the sales levels and make relevant decisions with respect to the same.
Break Even Sales Formula Explained
Break even sales formula allows managers and executives to calculate the revenue for which the profit earned is zero. The amount takes into account the fixed expenses as well as variable expenses to figure out the exact sales level.
In the expression,
- FC is the Fixed Cost
- ASP is the Average Selling Price per unit
- AVC is the Average Variable Cost per unit
The numerator of the equation is Fixed Cost, which shall be incurred irrespective of whether a single unit is sold or not, and hence that cost has to be recovered before the firm could start making profits.
The denominator of the equation is contribution per unit, which is a difference in selling price per unit, and the average variable cost per unit. As the Variable cost are those costs which is incurred only when the firm sells the units and hence the remaining would be the contribution, and that shall be used to recover the fixed cost.
Revenue vs Sales Explained in Video
Calculation Examples
Let us consider the examples to see how break even sales can be computed:
Example #1
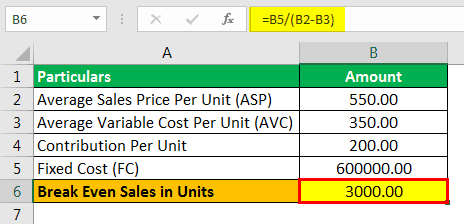
Suppose that sales per unit are 550, and the variable cost per unit is 350. The total fixed cost of the firm is 600,000. You are required to calculate Break-Even Sales in units based on the above information.
Solution
- Average Sale Price per Unit: 550.00
- Average Variable Cost per Unit: 350.00
- Contribution Per Unit: 200.00
- Fixed Cost (FC): 600000.00
Calculation of Break-Even Sales can be done as,

=600000/(550-350)

Example #2
Thomas & Thomas are thinking of launching one of the below two products as their market capitalization has been hit by competition, and now, they are looking back to bounce back in the market by introducing new products and increase shareholder value by increasing the firm's profitability.
Below are the details of the two products based on market research and estimation.
| Particulars | Product X | Product Y |
|---|---|---|
| Average Sale Price per Unit | 20.00 | 15.00 |
| Material Cost per Unit | 10.00 | 3.00 |
| Labor Cost Per Unit | 9.00 | 6.90 |
| Variable Overhead per Unit | - | 4.14 |
| Fixed Cost (in '000) | 74880.00 | 74880.00 |
Since they are looking to add value to shareholders as soon as they can, they want to select the product which shall comparatively lower the sale of units to recover the cost.
You are required to calculate Break-Even Sales in units and advise which product should be launched?
Solution:
Here we are given to analyze two products, and the one that takes a lesser number of units to sell to recover the cost shall be selected for the time being.
Now, we can calculate BES in units for both the products:
Calculation of Break-Even Sales of Product X can be done as,

Product X will be -

Calculation of Break-Even Sales of Product Y can be done as,

Product Y will be -

Based on the above comparison, it appears that product X should be launched as it takes a lesser number of units to sell to recover the fixed cost of the firm.
NOTE
In this example, we are ignoring the gross profit margin. The firm could make otherwise selecting product Y if the profit margin is considered.
Example #3
Veronica started a new business of selling hotdogs alone. She realized that most of the cost is variable, and the only fixed cost she would incur is the movable vehicle, which she will use to do business. After operating business for the year, she has come out with the below details:
- Sales During the Period: 1000000
- Cost of Bread used in Hotdogs: 400000
- Cost of Spreads Used: 300000
- Cost of Vegetables: 200000
- Annual Maintenance: 75000
- Annual Insurance: 35000
- Net Profit of Year: -10000
She noticed that she incurred a loss of 10,000 after accounting for all the expenses, and the takeover at home was zero, and in fact, she had to introduce 10,000 worth from home funds.
She desires to earn 50,000 net profit next year, but before that, she wants to know how she needs to how much she should sell so that she doesn't incur losses next year. Assume that last year she sold 10,000 units.
You are required to calculate Break-Even Sales assuming the cost remains the same next year as well.
Solution
First, we need to calculate the sales and variable cost per unit and also the total fixed cost.
Selling Price Per Unit

=1000000/10000
- Selling Price Per Unit = 100
Average Variable Cost Per Unit

=900000/10000
- Average Variable Cost Per Unit = 90
Total Fixed Cost to be recovered

=75000+35000
- Total Fixed Cost = 110000
The calculation can be done as,

Break-Even Sales will be -

Therefore, the total minimum sales required next year will be 11,000 x 100, which is 11,00,000
Relevance
There are several ways to use this important concept in the field of finance. Production executives and managers have to be aware of their sales levels and how far or close they are to recover the variable and fixed cost every time. That's the key reason that these managers keep constantly trying to alter those key elements in the formulas to reduce or increase the number of units to produce as per the situation and accordingly maintained the profitability of the firm. Further, it is worth noting that firms can avoid non-cash fixed costs like depreciation to calculate advance cash break-even sales.

