Table of Contents
What Is A Bollinger Band Squeeze?
Bollinger band(BB) squeeze is an indicator used in technical analysis, which depicts low market volatility and suggests that a high volatile period may come in the near future. John Bollinger invented this concept.
In this indicator, the upper and lower bands of the BB come very close to each other, displaying a squeeze. This narrowing of the bands is followed by a breakout, which may be on the upside or the downside, depending on current market conditions. This strategy is commonly used while trading in various asset classes, like stocks, commodities, currencies, derivatives, etc.
Key Takeaways
- Bollinger band squeeze is a technical indicator that shows a narrowing or contraction of the upper and lower bands of the indicator.
- The analysis of the same reveals that there is a reduction in price volatility within the market or the asset class.
- This also suggests that there is a strong possibility of an increase in future volatility and a breakout on the upside or downside.
- It can be used for price analysis of various asset classes and accordingly take a buy or a sell decision.
Bollinger Band Squeeze Explained
Bollinger band squeeze is a concept in technical analysis of financial instruments in which the two bands of the indicator come very close to one another, suggesting a fall in price fluctuation. This is usually followed by a rise in fluctuation and a breakout either upwards or downwards within the market.
A short explanation about the BB will help in this case. In this indicator, there are two bands, upper and lower, that are plotted in the chart, within which the candlesticks move. In the bollinger band squeeze formula, the band or the lines are plotted using standard deviation to assess the volatility from the simple moving average (SMA) line of asset prices that passes through the middle of the indicator.
The default setting is two standard deviations from the SMA. The deviation, away from the SMA line, either positively or negatively, suggests the volatility. It is easy to understand and interpret the high and low prices from the chart using this process and also identify any breakout that will appear in the form of green or red candlestick on the upper or lower band, with good volume.
Thus, a 20-day closing price SMA is taken. A bollinger band squeeze indicator happens when the bands are very close to the SMA line, which means the distance between the bands is very small. The difference is lower in the case of assets that have lower prices, showing lesser Bandwidth or contraction within the band. However, it should be noted that this indicator provides information about volatility and not the direction of the market.
How To Identify?
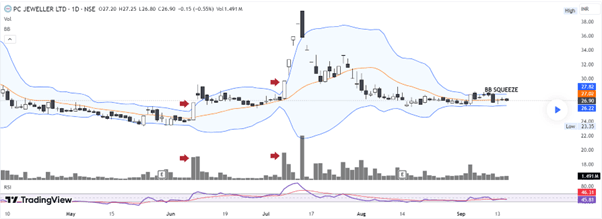
It is possible to understand the bollinger band squeeze indicator using charts from TradingView, as given below. In the chart below, there is a BB squeeze, clearly visible, and red arrows mark the area. As suggested in the explanation above, the contraction zone is followed by a BB expansion zone, where the prices are very volatile. This happens because alternative contraction and expansion in the financial market are natural processes.
The positive bollinger band squeeze breakout are also visible both at the beginning and end of the contraction zone of the area of BB squeeze, accompanied by high trading volume to support the breakout. The squeeze is also seen at the end of the chart, in which the contraction is much more than the other parts of the chart, suggesting significantly less volatility.
How To Trade?
It is essential to understand the concept and also get clarity regarding the trading process using it.
A squeeze means that bands are very close to one another, as well as the SMA line, suggesting very low price fluctuation. Therefore, traders can start planning their future trading moves because there is an indication of a sudden burst of fluctuation.
Traders should ideally wait for a breakout in the form of a green bullish or bearish red candle, depending on market conditions. If there is a bullish green candle, a trader with a high-risk appetite may take a long position, anticipating an upward trend. A trader with a low-risk appetite may wait for another confirmation before taking the trade.
Since it only suggests the volatility and not the direction or momentum of the same, it is better to combine it with the relative strength index (RSI), which will give the correct idea about the entry and exit levels. Combining BB squeeze with RSI will show whether the bollinger band squeeze breakout is actually the overbought or oversold positions, as per the RSI or not.
A positive breakout in BB from the squeeze, along with an RSI above the 70 level, means it is in an overbought position, and the market has every possibility of showing a downtrend in the coming trading sessions. The opposite will happen if there is a bearish breakout from the squeeze and the RSI shows a below-30 level.
Examples
Here are some suitable examples to explain the concept bollinger band squeeze strategy.
Example #1
Jacob is a long-term investor who wants to buy the stock of PC Paints because of its good future market outlook, given the burst of development in the real estate sector. He tracks the stock using BB, which is very close to the SMA line and has shown very low volatility over the past six months. He anticipates a positive breakout in the stock. Soon, there is a small green candle with good volume. But Jacob, being a risk-averse investor, decides to wait for confirmation from another green candle. The RSI supports the upward trend because it is at only 40-level, which means there is a chance of the stock going up in the future. The next candle, another green one, serves as the entry-level for him.
Example #2
Gail India Ltd has shown a BB squeeze, suggesting that there may be a breakout very soon after this period of consolidation. Along with the squeeze, the stock has also formed an Adam double bottom pattern, which is at the 52-week low price level. After staying for a few days on the neckline of the double bottom pattern, the stock may have a positive breakout because all other indicators, like the MACD, RSI, and the moving averages, have suggested a bullish trend in the future, supporting the bollinger band squeeze strategy.
Benefits
Some noteworthy benefits of the concept are given below:
- Bollinger band squeeze formula is an excellent indicator for understanding the current level of price volatility in the market.
- There is always a possibility of breakout in the future. Therefore, traders can expect a change in the trend.
- It is easy to understand and use in the financial market.
- It can be used against any timeframe and get volatility indications related to any asset class.
Limitations
The limitations of the concept are as follows:
- Since it only shows the volatility levels and does not provide much information about the direction and momentum of the same, it has to be combined with other indicators for better results and confirmation.
- It often gives false breakouts and trading signals, which may misguide the traders, making them make incorrect investment decisions.
- It cannot be used as a standalone indicator and has to be combined with another commonly used and reliable technical process to get an explicit confirmation.
For professional-grade stock and crypto charts, we recommend TradingView – one of the most trusted platforms among traders.
Disclosure: This article contains affiliate links. If you sign up through these links, we may earn a small commission at no extra cost to you.