Table of Contents
What Is Black Marubozu?
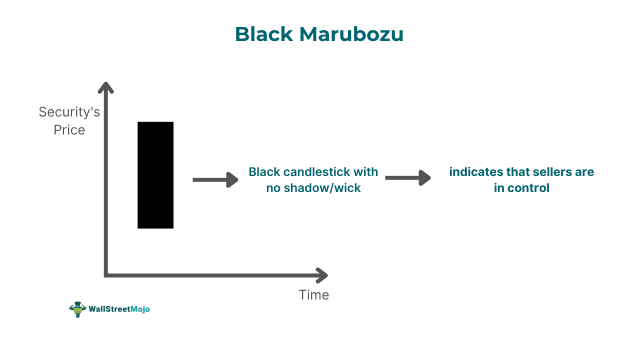
Black Marubozu is a black candlestick with little to no shadows or wicks. It depicts the strength of sellers in the market and helps traders spot the possibility of a trend reversal or a downtrend continuation.

The longer the black candle, the higher the decline in price and the stronger the bearish sentiment. Typically, since there is no wick, the opening price is the day’s high while the close is the day’s low. While this candlestick can provide important insights concerning market sentiment and trends, one must not rely solely on it, per experts.
Key Takeaways
- Black marubozu candle meaning refers to a bearish candlestick that appears in the price chart of a stock or any other financial instrument, signaling that the buyers do not have any control in the trading session.
- One can use it along with other tools utilized by technical analysts to make trading decisions.
- Such a candlestick can be of three types — marubozu open, marubozu full, and marubozu close.
- Two key features that make this candlestick easily identifiable are little to no shadow and a black or red candle.
Black Marubozu Candlestick Pattern Explained
The Black Marubozu candle meaning signifies it as a bearish candlestick pattern, showing the determination of the market to move in the downward direction without encountering any significant pressure from the buyers. It represents no buying interest and enables traders to understand the market sentiment and predict a trend continuation or a reversal.
That said, one must use different indicators and a black marubozu candle to decide whether to buy or sell a financial instrument.
The different forms of Black Marubozu patterns are as follows:
- Marubozu Open: A Marubozu open candle has a black body with no wick on the top but a small shadow on the bottom.
- Marubozu Close: This candlestick has a black body with a shadow on the top.
- Marubozu Full: A Marubozu full candle does not have any wick.
A Black Marubozu candlestick’s formation is not a confirmation that a financial instrument’s price will continue to decrease. The bulls may regain market control the following day or trading session. Hence, it is vital to wait for the formation of the other candles after the marubozu.
Also, individuals should consider using different technical analysis tools, such as trend lines, volume, channels, oscillators, etc., along with this bearish candle to increase the chances of executing successful trades.
How To Identify?
The distinct features of a Black Marubozu pattern make it easily identifiable. Let us look at those characteristics below:
- Single-Candle Pattern: It is a single candlestick pattern.
- Black/Red Body: The candlestick is red or black in color, depicting a downward price movement. In other words, it is a bearish candlestick.
- Little to No Wick: The shadows are either absent or extremely small, representing the sellers’ strength in the trading session.
How To Read?
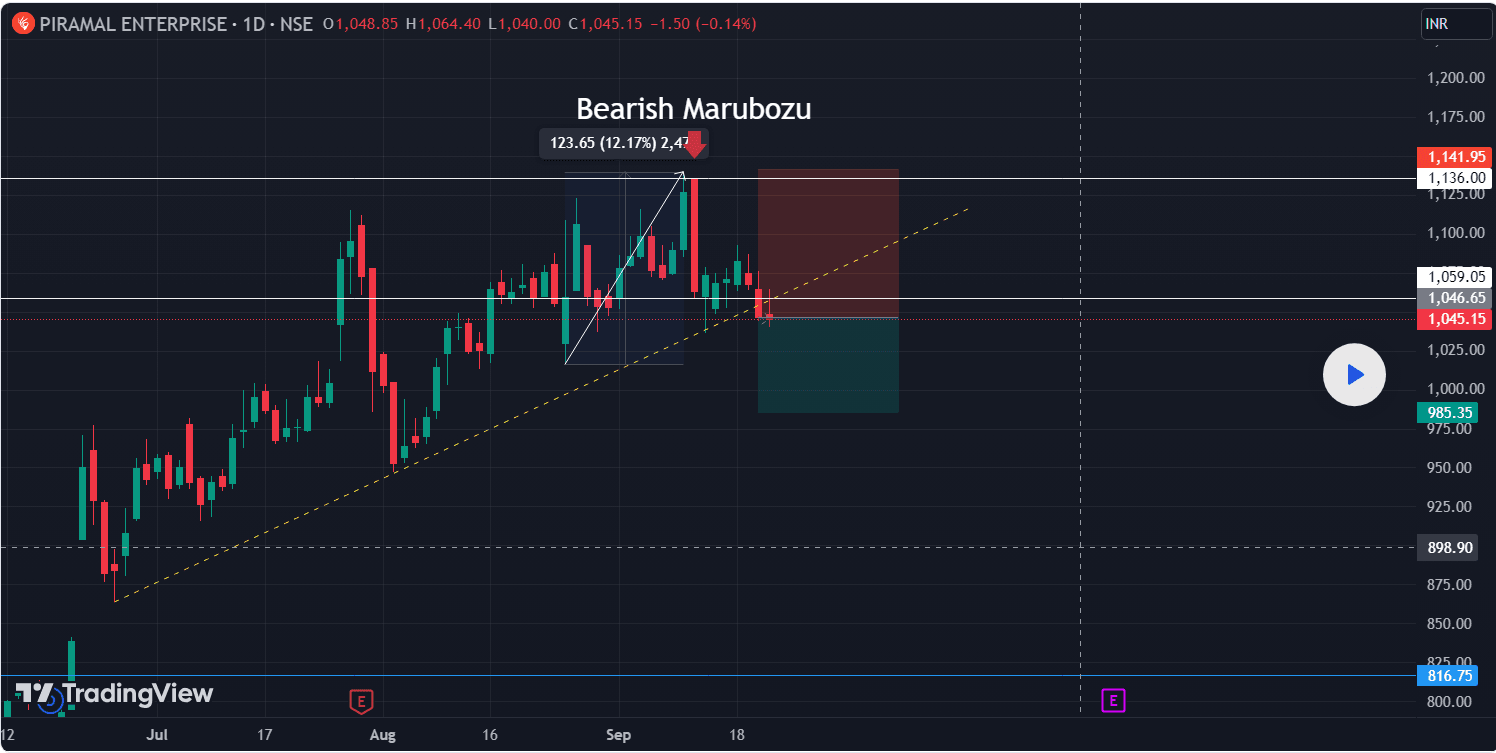
Let us look at the following 1-day Piramal Enterprise chart to understand the interpretation of such a candlestick.

The above TradingView chart shows the formation of a black or bearish marubozu candlestick on September 22, 2023. It shows that the bears were in complete control on that day as they pushed the price downward. This is the marubozu open variant, as there was no upper wick but a lower shadow. This means the open and the day’s high were the same, i.e., ₹1,136, and the day’s low (₹1046.65) was very close to the closing price recorded in that trading session.
As one can observe in the above chart, the patterns appear at the end of an uptrend, thus indicating a potential trend reversal. As we can see, there was no clear confirmation that a downtrend had materialized. Hence, it is vital to consider other indicators, like volume, Relative Strength Index (RSI), etc., to make buy or sell decisions.
How To Trade?
Let us look at some popular strategies to trade such patterns.
1. Pullbacks On Naked Price Charts
This strategy involves waiting for a pullback to begin and then identifying the bearish marubozu pattern. The pattern often confirms the pullback’s end and the beginning of a downside move.
2. Trading With Resistance Levels
If individuals wish to utilize this strategy, they can follow these steps:
- Draw the resistance levels on the financial instrument’s price chart.
- Wait for the security price to increase and get to the resistance level.
- Observe and verify whether the formation of bearish Marubozu has occurred at that level.
Lastly, enter a short position, anticipating a downside move once the price breaks Marubozu’s low.
3. Trading With Relative Strength Index Divergences
This trading strategy involves the following steps:
- Spot an upward trend.
- Mark all the highs that the security’s price makes, following each leg toward the upside
- Simultaneously, compare those highs using RSI.
- If RSI makes lower highs while the asset price makes higher highs, it is a sign of divergence.
- Wait until a bearish Marubozu forms at a higher high that is aligned with a relative strength index lower high.
- Enter a short position when the security’s price breaks the bearish Marubozu’s low.
When using any of the above strategies, one must consider using stop-loss and take profit orders to limit losses and secure gains.
Examples
Let us look at a few black marubozu examples to understand the candlestick better.
Example #1
Suppose a trader named John was tracking XYZ stock for a week. He found that a long Black Marubozu appeared on its price chart after a sharp uptrend, thus signaling that a downward trend might be on the horizon. He waited for the next candle to form, and it was also a bearish candle with a long body. Instead of considering it only, he checked the volume indicator and found that the trading volume increased significantly. Taking these indicators into account, he entered a short position.
It turned out he made the right trading decision as the price plunged 20% over the next 3 days, and as a result, John made substantial financial gains.
Example #2
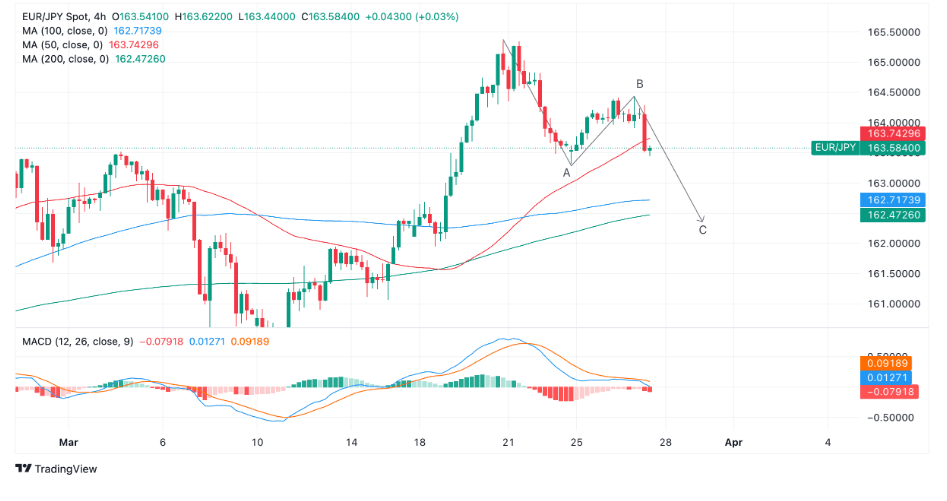
On March 27, 2024, in the EUR/JPY currency pair candlestick chart, a long black marubozu appeared, which added a bearish tone. Let’s look at the chart below to understand better.

Per analysts, even if a pullback materialized following the sell-off, it would likely go as high as the bearish Marubozu’s midpoint, i.e., 163.90, prior to probably continuing to drop lower.
At that time, the trend for the short term was unclear. However, a break below wave A’s low (163.32) would give confirmation, changing the dynamics in favor of a downward trend and wave C’s continuation.
For professional-grade stock and crypto charts, we recommend TradingView – one of the most trusted platforms among traders.
Disclosure: This article contains affiliate links. If you sign up through these links, we may earn a small commission at no extra cost to you.

