Table Of Contents
What Is Beta Coefficient?
The beta coefficient formula is a financial metric that measures how likely the price of a stock/security will change concerning the movement in the market price. The Beta of the stock/security is also used for measuring the systematic risks associated with the specific investment.
The beta is the degree of change in the outcome variable for every 1 unit change in the predictor variable. A standardized beta compares the strength of the effect of each independent variable to the dependent variable. The greater the absolute value of the beta coefficient, the stronger the impact will be.
The beta formula is used in the CAPM model to calculate the Cost of Equity as shown below -
Cost of Equity = Risk Free Rate + Beta x Risk Premium
Key Takeaways
- The beta coefficient formula is a tool used to gauge a stock's susceptibility to market fluctuations and evaluate investment risks. It measures how much the stock's outcome changes for each 1 unit change in the market.
- Beta plays a vital role in the Capital Asset Pricing Model (CAPM), a method used to determine the expected rate of return for a specific stock or portfolio based on its risk in relation to the market.
- A negative beta investment moves inversely to the overall stock market. When the market rises, a negative beta investment tends to fall, and vice versa.
Beta Coefficient Meaning
The Beta is calculated in the CAPM model (Capital Asset Pricing Model) for calculating the rate of return of a stock or portfolio.
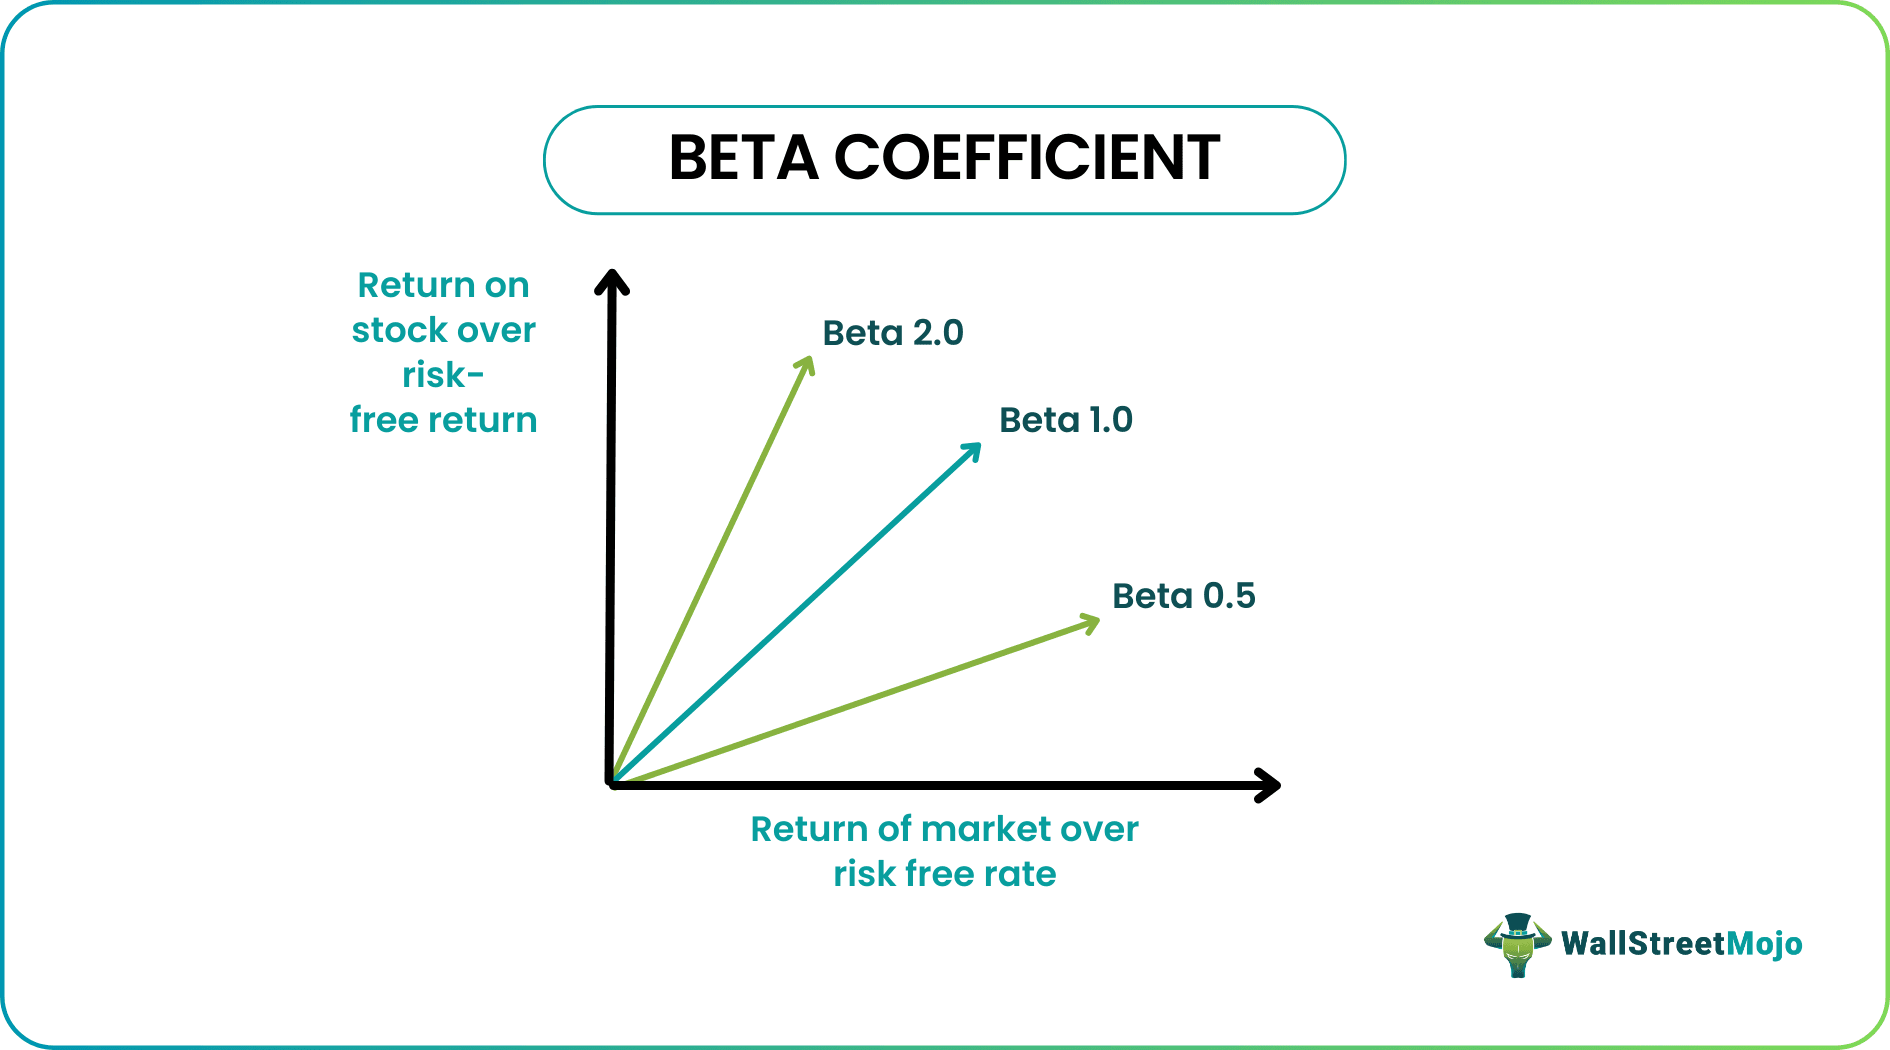
The Beta calculation in excel is a form analysis since it represents the slope of the security's characteristic line, i.e., a straight line indicating the relationship between the rate of return on a stock and the return from the market. It can further be ascertained with the help of the below Beta formula:
β = Covariance of Market Return with Stock Return / Variance of Market Return
The meanings of beta coefficient -
- If the coefficient is 1 it indicates that the stock /security price is moving in line with the market.
- If the coefficient <1; the return of the security is less likely to respond to the market movements.
- If the coefficient > 1, the returns from the security are more likely to respond to market movements, thereby also making it volatile;
Video Explanation of Beta Coefficient
Beta Coefficient Example
If Apple Inc’s (AAPL) beta is 1.46, it indicates that the stock is highly volatile and 46% more likely to respond to market movement. On the other hand, say Coca-Cola has a β coefficient of 0.77, indicating the stocks are less volatile and 23% less likely to respond to movement in the market.
As a trend, it has been observed that utility stock has a CAPM Beta of less than 1. On the other hand, technology stocks have a Beta coefficient of greater than 1, indicating a likelihood of higher returns with more associated risks.
Beta Coefficient Calculation
Here we will take an example to calculate the beta of MakeMyTrip (MMTY) and the Market index as NASDAQ.
You may download the fully solved Beta Calculation Excel Worksheet from here.
There are three Beta formulas - variance/covariance method, slope function in excel, and regression formula. We will see each of the beta coefficient formulae below -
Step 1 - Download Historical prices and NASDAQ index data from the past 3 years
I have downloaded the data from yahoo finance.
- For the NASDAQ dataset, please visit this link Yahoo Finance.
- For Makemytrip prices, please visit this URL here.
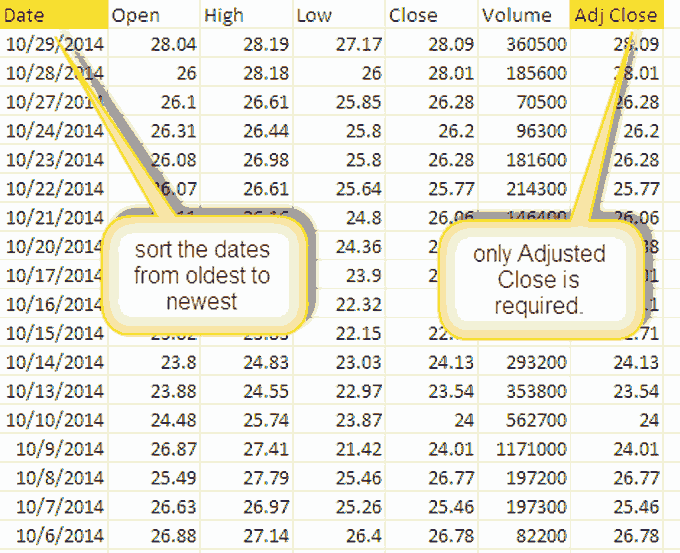
Step 2 - Sort the Prices as given below
Sort the dates and adjusted closing prices in the ascending order of dates. You can delete the remaining columns as we don’t need those for beta calculations in excel.
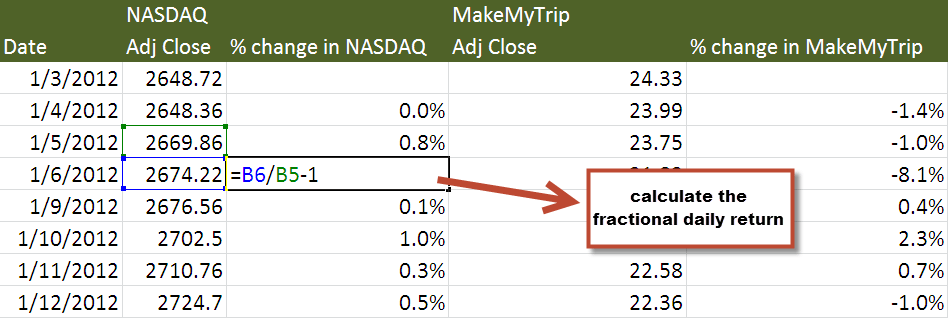
Step 3 - Prepare the beta coefficient excel sheet as per below.
Step 4 - Calculate Daily Returns
Return = / Opening Share Price
Step 5 - Calculate Beta Formula using the Variance-Covariance method
You need to use the two formulas (variance and covariance in excel), as shown below.
Using the variance-covariance method, we get the Beta as 0.9859 (Beta Coefficient)
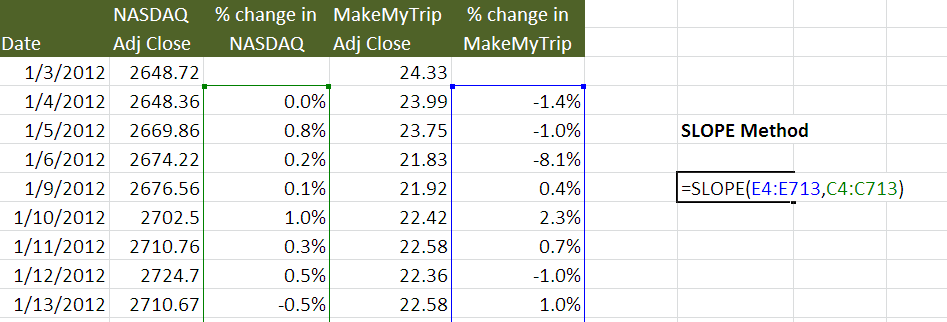
Step 6 - Calculate Beta using SLOPE Function in excel
Using this SLOPE function in excel, we again get the Beta as 0.9859 (Beta Coefficient)
Step 7 - Calculate Beta Coefficient Regression
To use this regression function, select Data analysis from the Data Tab of your Excel Worksheet.
If you cannot locate Data Analysis in Excel, you need to install the Analysis ToolPak. This process is relatively easy: Go to FILE -> Options -> Add-Ins -> Analysis ToolPak -> Go -> Check Analysis ToolPak -> OK
Select Data Analysis and click on Regression
Choose the Y Input Range and X Input Range
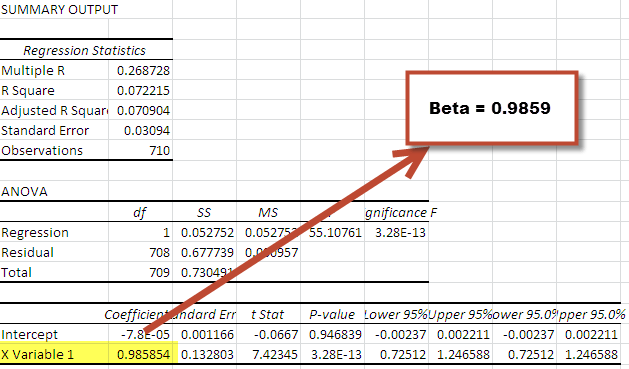
Once you click OK, you get the following Summary Output.
You will get the same Beta in each of the three methods.
Advantages of Beta Coefficient Regression
CAPM estimates an asset's Beta based on the systematic risk of
- The market. It is used for beta regression to estimate the Cost of Equity in Valuation models. The cost of equity derived by the CAPM reflects a reality through which investors have diversified their portfolios to reduce the impact of the systematic risk. The following are some of the advantages of Beta regression:
- It offers an easy-to-use beta calculation in excel, which standardizes a risk measure across multiple firms with varied capital structures and fundamentals.
Disadvantages of Beta Coefficient Regression
The following are some of the disadvantages of Beta regression:
- There is a heavy reliance on past returns and does not consider updated information/other factors that can impact the returns in the future.
- Beta regression as more return is garnered, the measure of Beta changes, and so will the cost of equity.
- Though systematic risks are inherent to the market in explaining asset returns, the portion of unsystematic risks is ignored.
Negative Beta
A negative beta formula means an investment that moves in the opposite direction against the stock market. When the market rises, the negative beta tends to fall, and the negative beta will tend to rise when the market falls. It is generally true for gold stocks and gold bullion. Since Gold is a more secure store of value than currency, a crash in the market prompts investors to liquidate their stocks and convert them into currency (for zero betas) or purchase gold in case of a negative beta coefficient.
A negative beta does not highlight that risk is absent, but it means that the investment offers a hedge against an unforeseen market downturn. However, suppose the market continues to rise. In that case, a negative-beta coefficient strategy is losing money through opportunity risk (loss of a specific chance to earn higher returns) and also inflation risk (rate of return not keeping pace with the prevailing inflation in the country).

