Table of Contents
What Is Bearish Rectangle Pattern?
Bearish rectangle pattern refers to a candlestick arrangement in a chart used for technical analysis. Traders use it to identify reversal from an uptrend, which means the market is showing a tendency to go down shortly.
In this concept, after a steady previous downtrend, typically, there is a consolidation phase, which looks like a rectangle. Then, a breakout happens with a red bearish candle to signify a down move, along with volume. It is more significant in a less volatile market that shows trends.
Key Takeaways
- Bearish rectangle pattern is a chart pattern used in technical analysis to detect trend reversal.
- In this pattern, after a long downtrend, there is a consolidation in the market, forming a rectangular candlestick arrangement, after which there is a downward breakout.
- It gains more significance if the market is less volatile but has the potential to show a trend along with good volume.
- Traders widely use it in the financial market to identify trend changes and take advantage of the price moves to earn profits.
Bearish Rectangle Pattern Explained
Bearish rectangle pattern is a visual representation of a candlestick arrangement, where there is a downtrend after a long previous downtrend followed by consolidation in the market. It is a widely used technical indicator that traders find easy to understand and use while making trade decisions.
The change in trend in a bearish rectangle chart pattern is visible due to the appearance of a very small green candle followed by a large red bearish candle that will completely engulf the previous green one. This is a strong indicator, that shows the weakness of the buyers and the increase in strength of sellers.
This is an ideal time for traders to either exit the market if they are already long off on any financial instrument or enter the market with a short position, thus, taking advantage of downward price movement to earn significant profits.
It is ideal to use a stop loss during trading, to avoid any significant losses in case the market does not move in the anticipated direction. This will help in controlling or minimizing the loss in such cases. However, it is advisable to combine it with other useful and reliable technical indicators that denote trend reversal, to get a better confirmation.
Characteristics
Some noteworthy characteristics of the concept of bearish rectangle chart pattern are as follows:
- The trader should look for a downtrend that has already occurred in the previous trading sessions.
- The previous downtrend should be followed by a consolidation phase for some trading sessions which will finally show a breakout.
- It is possible to draw upper and lower trend lines during the consolidation phase, which will lead to the formation of the rectangle.
- Each of the above phases may last for a few days to a few weeks.
- During the market consolidation phase, the volume will typically remain low, with a sudden increase in the breakout phase.
- There will be a breakout from the consolidation phase, that will show with a small green candle followed by a big red bearish candle that engulfs the previous candle to indicate a selling pressure.
How To Identify?
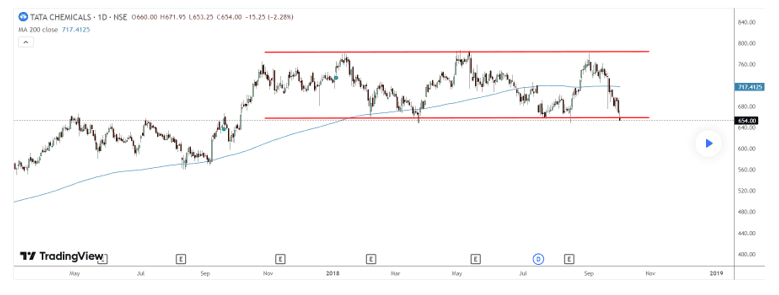
It is possible to identify this pattern using a chart from TradingView. In the chart below, the rectangle pattern is visible, and the upper and lower trend lines are drawn to identify the shape of the pattern. Then, there is a small bearish breakout at the support level, signifying a possible downtrend in the future. It should also be noted that before the consolidation phase represented by the rectangle, there has already been a long downtrend in the stock.
The trader should wait for a confirmation with a big red bearish candle, which will help the trader to be sure that the move will be downwards. This will lead to a profitable trade in the future.
How To Trade?
There are some important steps that traders should follow while trading in the market using this bearish rectangle pattern target. They are as given below:
- The trader should first wait for a clear confirmation of the pattern, in the form of a bearish breakout with a spike in trading volume.
- Next, it is a good idea to wait for a confirmation in the form of another red candle, after the price breaks from the support level.
- Stop loss is very important in any kind of trade. Therefore, here too, the stop loss should be placed just above the resistance, to avoid huge losses in case the market moves up and the trader has taken a short position.
- It is possible to fix the profit target by measuring the height of the rectangle and placing it below the support level from where the downward breakout happened.
- The trader should measure the risk-reward ratio before taking the trade and ensure the reward or return is more than the risk to make the trade profitable.
- Monitoring the trade is important since this will ensure the correct strategy is used and, if required, changes are made on time to avoid losses.
Examples
Some suitable examples may be used to understand the concept of bearish rectangle pattern target in detail.
Example #1
Jacob is a long-term investor who is already holding the stocks of ABC Ltd. After going through the daily chart of the stock, he has noticed that the stock has been under a long consolidation mode after a few trading sessions of a downtrend. Now he is quite sure that the stock may show a further down move after this. He waits for a further confirmation and sure enough, a small green candle appears just below the support zone, followed by a big red engulfing candle, confirming a bearish trend in the coming trading sessions. Jacob exits the books his profits and exits the market at the level of the red bearish candle.
Example #2
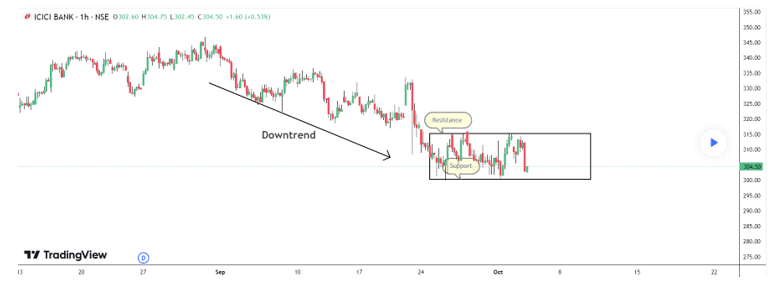
In the chart below, there is a rectangle pattern which is seen after a long consolidation that follows a downtrend. Here, in the stock of ICICI Bank, a very small green candle appears below the support zone. This indicates that the consolidation phase is almost over and now there may be a further downtrend. This will be confirmed once a big red candle appears after the green one, to support the view.
Bearish Rectangle Vs Bullish Rectangle Pattern
Both chart patterns are commonly used to identify trend reversals related to the trading of any financial instrument. But there are some differences between them, as follows:
- The former is a reversal downwards and the latter is a reversal upwards.
- The former occurs after a previous downtrend followed by a consolidation and the latter occurs after the previous uptrend followed by a consolidation.
- The former is confirmed when there is a breakout with a bearish big red candle and the latter is confirmed when there is a breakout with a bullish big green candle.
- The breakout in case of the former will occur at the support zone and the breakout for the latter will occur at the resistance zone.
- In the case of the former, the trader should sell off the asset or go for a short position but for the latter, the trader should go for a long position.
For professional-grade stock and crypto charts, we recommend TradingView – one of the most trusted platforms among traders.
Disclosure: This article contains affiliate links. If you sign up through these links, we may earn a small commission at no extra cost to you.

