Table Of Contents
What Is A Bear Flag Pattern?
The bear flag pattern is a chart pattern in technical analysis that signifies continuing an ongoing downward movement in an asset price. This pattern indicates a bearish market sentiment. It assists traders in recognizing the potential asset price movements and making informed investment decisions to maximize the returns.

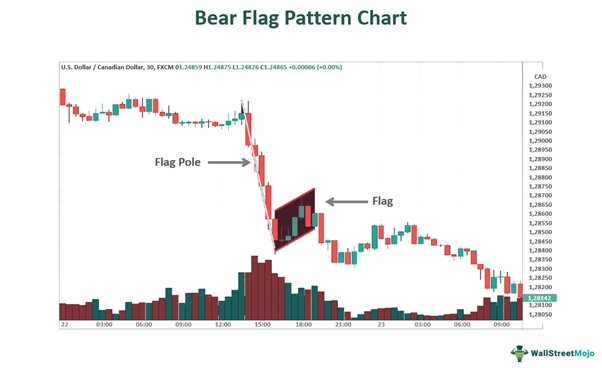
This chart pattern comprises three critical elements. It starts with a visible asset price decline, suggesting a bearish sentiment. Soon after, a consolidation period follows in which the price moves sideways and forms a flag-like shape. This phase represents a temporary pause in the downtrend. Lastly, the price usually breaks down below the lower boundary of the flag, confirming the original bearish trend and resulting in further price declines.
Table of contents
- What Is A Bear Flag Pattern?
- The bear flag pattern is a significant instrument in technical analysis that uses a chart pattern to signify the continuation of an ongoing downward price trend. It represents a bearish market sentiment and reflects that the ongoing downtrend will likely persist after a brief consolidation period.
- Traders can analyze this pattern to obtain insights about the overall market sentiment and make informed trading decisions.
- However, this chart pattern must be employed along with other technical analysis tools to ensure accuracy.
Bear Flag Pattern Explained
The bear flag pattern is a technical analysis tool that comprises a chart pattern signaling a potential continuation of a downtrend. It is a bearish continuation pattern, suggesting that the existing downtrend may persist after a temporary consolidation period. Traders can gain insights into market sentiment by analyzing this pattern's characteristics. It aids them in improving their trading strategies, risk management, and making informed trading decisions.
The pattern consists of three essential components that traders monitor for potential trading opportunities. They are as follows:
- There is a prolonged decline in the asset's price. This initial downtrend is driven by bearish market sentiment, where the sellers outnumber the buyers. As a result, the price steadily decreases over a period.
- In the pattern's second phase, the consolidation or flag formation, the price movement enters a period of relative stability. The consolidation phase takes the form of a flagpole and flag-like pattern. This pattern shows that the traders are pausing after the sharp decline in the price, reflecting uncertainty and a possible shift in the market sentiment.
- The third and final element is the breakdown or continuation of the bearish trend. When the price breaks below the lower boundary of the flag pattern, it indicates that the bears have regained control and the selling pressure has increased. This breakdown confirms the pattern's validity and signals the continuation of the original downtrend.
Examples
Let us study the following examples to understand this pattern:
Example #1
Suppose the stock prices of Serene Hotels Ltd. were in a downtrend for a while. Its price was decreasing steadily due to negative market sentiment. Suddenly, the stock's price movement stabilized, and it stopped going up or down significantly. This stability phase formed a flag-like pattern on the price chart, where the pole acted as the initial downtrend, and the flag was the consolidation phase.
When the stock's price broke below the flag pattern's lower boundary, it confirmed the formation of the pattern. This breakdown signified that the bearish market sentiment resumed, and the stock price was likely to continue its downward movement.
Example #2
On 13 June 2023, the Shiba Inu crypto traded higher in the day trading session. It displayed more strength than Dogecoin. The crypto sector overall was trading lower after the United States Labor Department released the consumer price data showing that inflation came in lower than anticipated. Despite its slight increase, the Shiba Inu was forming a bear flag chart pattern.
How To Identify?
The bear flag pattern chart can be identified by using the following steps:
- Traders may recognize a sudden, upward movement in the asset price.
- They may create a bearish trendline that acts as the flag pole.
- They must determine a timeframe with sideways price movement.
- Finally, the traders can draw a line on the upper and lower boundaries. The trading range lying inside the boundary lines is the flag.
The same thing is also represented using chart from TradingView, as follows:

How To Trade?
The bear flag pattern trading can be carried out in the following steps:
#1 - Identifying The Trend
Trading this pattern begins with recognizing a visible downtrend. The multiple timeframe analysis may help traders identify the pattern.
#2 - Defining The Flag
In the next step, the trader must define the flag part in the chart pattern. To illustrate the flag, the trader may recognize a timeframe with a consolidation phase immediately after the flagpole, where the asset price moves sideways. The trader may create an upper trend line to define the flag's upper boundaries and draw a lower trend line to display the flag's lower limits.
#3 - Selling Rules
In the final step, the trader may place the trade. They may set a sell order below the flag's lower trend line. It acts as the entry point to the market. Additionally, they may place a stop order above the flag's upper trend line to determine the stop-loss order.
Benefits & Risks
The bear flag pattern trading benefits are:
- This chart pattern provides a visual confirmation of a downtrend's continuation. Traders can use this pattern to strengthen their market sentiment analysis and enhance their conviction in holding or entering short positions.
- Traders can identify potential entry points for short positions by identifying the pattern in the early stages as the price breaks below the flag's lower boundary. Moreover, it can help them recognize when to exit their positions, maximizing profit potential.
- Identifying the chart pattern may help traders in setting stop-loss levels more effectively. Placing stop-loss orders above the flag's upper boundary can help limit potential losses if the pattern fails to provide the expected results.
- The pattern reflects market sentiment and indecision shifts during the consolidation phase. Understanding these psychological aspects can provide valuable insights into the market dynamics and potential price movements.
- The chart pattern works well with other technical indicators and analysis methods. Traders can merge it with tools like moving averages, trendlines, or volume analysis to strengthen their trading strategies and increase accuracy.
The risks are as follows:
- Like any chart pattern, this pattern is not always accurate and may sometimes provide false signals. Traders may act on the pattern's suggestion, but the asset price may move in the opposite direction, resulting in potential losses.
- Identifying this pattern requires subjective judgment. Thus, the pattern's interpretation may be according to each trader's decision. This subjectivity can lead to inconsistent or conflicting analyses and create confusion.
- Market conditions often change rapidly, and the pattern may not be accurate during periods of high volatility or unexpected news events. The rapid price movements can invalidate the pattern, leading to unpredictable outcomes.
Bear Flag vs Bull Flag
The differences are:
- Bear Flag: Traders use the bear flag pattern chart in financial markets to identify potential trends and price movements. This bearish continuation pattern indicates a temporary pause in a downtrend before the price declines further. This chart pattern starts with a downtrend, with the asset price declining steadily, followed by a period of consolidation where the price shifts sideways, forming a flag-like shape. The pattern gets completed with a breakdown, signaling the continuation of the bearish trend.
- Bull Flag: The bull flag is a bullish continuation pattern during an uptrend. The pattern consists of three phases, starting with a noticeable uptrend, with the asset price rising steadily. Then a consolidation phase follows, during which the price moves sideways and forms a flag pattern. This represents a temporary pause in the uptrend. Finally, there is a breakout, as the price breaks above the upper boundary of the flag, indicating the continuation of the bullish trend.

In the chart of Lantheus Holdings, above, both Bull flag and Bear Flag is present. The Bull flag is marked in Green, and the Bear Flag is marked in Red. Proper comparison will reveal that after Bull flag, the market has gone up steadily while the continuation after the bear flag is a downtrend. Traders should know this and be able to spot such patterns skillfully so that they can successfully use the patterns in making correct trade decisions.
Bear Flag vs Bear Pennant
The differences are:
- Bear Flag: This is a bearish continuation pattern formed during a downtrend. It consists of three main components. It begins with a significant and sustained decline in the asset's price. Next, a consolidation phase follows, during which the price moves sideways and forms a flag-like shape. This consolidation indicates a temporary pause in the downtrend. Finally, the pattern concludes with a breakdown, as the price breaks below the lower boundary of the flag.
- Bear Pennant: This is another bearish continuation pattern similar to the bear flag. It is formed during a downtrend and comprises two main elements: a sharp and swift decline in the asset's price, following which a consolidation phase occurs. During this phase, the asset price forms a small symmetrical triangle pattern. The consolidation phase represents a short period of indecision in the market before the price continues its downward movement. The pattern ends with a breakdown as the price breaks below the pennant's lower boundary. In the chart of Matic Networks below, there is a clear Bear Pennant formed, The triangle is visible and market with dotted lines. After the pattern, the market moves downwards, indicating a bearish trend.

For professional-grade stock and crypto charts, we recommend TradingView – one of the most trusted platforms among traders.
Disclosure: This article contains affiliate links. If you sign up through these links, we may earn a small commission at no extra cost to you.

Frequently Asked Questions (FAQs)
The duration of this flag pattern can vary based on several factors, like the specific market conditions and the asset being analyzed. However, it generally lasts from a few days to a few weeks. The pattern's consolidation phase, which the flag formation displays, is usually shorter than the previous downtrend. Traders observe this pattern on shorter periods, like the daily or hourly charts, to recognize potential continuation signs in the bearish market.
Several factors can invalidate this chart pattern. Some of them are as follows:
- If the price breaks above the flag's upper boundary during the consolidation phase, it invalidates the bearish signal, and the pattern is no longer accurate.
- If the price fails to continue its downtrend after the pattern's breakdown, the pattern may be considered invalid. It indicates a potential trend reversal or change in market sentiment.
- Sudden and significant news events can disrupt the pattern's expected price movements, invalidating the pattern.
This pattern's reliability is moderate. It is a commonly used chart that provides valuable insights into market sentiment. However, it is not always accurate. Traders must use this pattern alongside other technical indicators and analysis tools to enhance their trading decisions.
