Table of Contents
Basing Meaning
Basing refers to consolidation in the price of an asset, for example, a stock, usually following a downward trend and preceding a bullish phase. This stabilization before the potential uptrend often indicates a trading opportunity. Also, individuals can utilize this consolidation phase to reevaluate and make adjustments to their strategies.
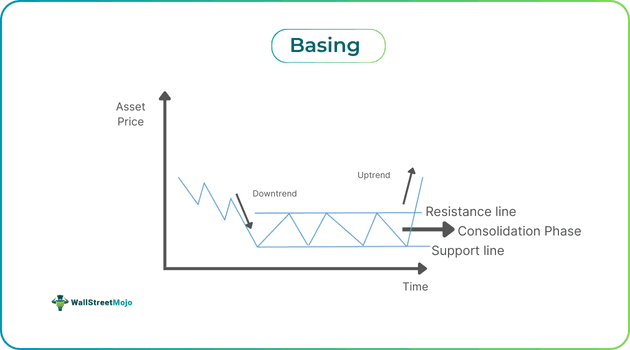
The sideways movement leads to a slightly rounded or flat price pattern formation, indicating an equilibrium between supply and demand in the market. During this phase, price volatility is generally low and may lead to a price reversal. The sideways price action is a sign of indecision and the lack of a clear trend.
Key Takeaways
- The basing definition refers to a period in which the price of an asset, commodity, or any other asset traded on a stock exchange moves horizontally following a certain trend. It signals the continuation of the last trend or a trend reversal.
- Two popular patterns that one can spot to identify basing in trading are the cup and handle and the flat base pattern.
- A noteworthy limitation of this pattern is that predicting future price movements using it can be challenging.
- This phase of sideways movement provides price stability and gives traders time to reevaluate their trading strategy.
Basing In Trading Explained
The basing definition refers to a pattern in technical analysis that occurs when the price of an asset moves horizontally after a particular trend. Generally, it signals stability in the market after a phase of volatility and gives traders time to carry out an analysis of the asset’s performance and reassess their strategies.
One must note that some assets, for example, stocks, may form a base lasting for many years before the establishment of a bullish trend. This sideways price action is usually crucial following a rapid decline in price so that a meaningful bullish reversal can start. Having said that, one must also note that the initial trend may continue following this pattern’s formation. In other words, this pattern’s formation leads to the continuation of the prior uptrend or downtrend.
The basing pattern’s formation accompanies decreasing trading volume and contracting volatility. It leads to the establishment of defined resistance and support levels as buyers and sellers fight to gain control of the market. The slight change in the highs and lows during this period renders the financial instrument trendless.
Types Of Basing Trading Strategies
There are two types of basing strategies. Let us look at them in detail.
#1 - Trend Reversal
Usually, contrarian investors utilize this strategy to identify an asset’s possible tops and bottoms. If the security’s price consolidates for a prolonged period, a breakout that occurs in the direction opposite to that of the previous trend often appeals to traders as they get ready to generate gains from the reversal. In this case, they utilize a stop-loss order to limit the losses that may arise in the case of a fake breakout and a drop in price.
One must ensure that the volume indicator is utilized when using this strategy, as a reliable breakout that is reliable generally takes place when the volume is higher than the average.
#2 - Trend Continuation
When using this strategy to spot an entry point, traders can make any of the following moves depending on the prior trend:
- Enter a long position once the price of the security breaks out above the consolidation phase’s high if the prior trend is an uptrend.
- Alternatively, they can enter a short position once the security breaks out below the consolidation phase’s low if the prior trend is a downtrend.
Note that the price breakout should accompany a higher-than-average trading volume as it shows that a large number of market participants are committed to the direction of the price.
Commonly, 50-day or 20-day moving average (MA) indicators represent the support level at a basing period’s end. This enables the MA to match the asset’s price. In the case of short positions, the MA serves as resistance.
A basing pattern that has a narrow range provides a healthy or favorable risk-reward ratio. Individuals can choose to place a stop-loss under the lowest traded asset price recorded during the basing period. As market participants anticipate the asset to begin trending again, traders can set profit targets in multiples of the stop-loss amounts to ensure that the major part of the move is secured.
How To Identify?
Individuals can identify different technical analysis chart patterns to spot basing in trading. Let us look at two such popular patterns in detail.
#1 - Cup And Handle
It is a U-shaped chart pattern that forms following a downtrend. Note that it may take weeks and even months to emerge in a price chart. Ideally, the depth of the cup must not be 1/3rd of the last uptrend, thus having a rounded bottom.
A slight drop in price forms the handle, and it accompanies reduced trading volume, depicting price consolidation or sideways price action. It signifies bearish investors’ last chance to exit their position prior to a possible bullish breakout. Note that this handle has to be shallow when compared to the cup, demonstrating indecision in the market.
The completion of this pattern takes place once the asset price breaks above the resistance volume, which should ideally happen with increased trading volume, indicating the start of an uptrend.
Let us look at this TradingView chart to understand how to identify the pattern clearly.
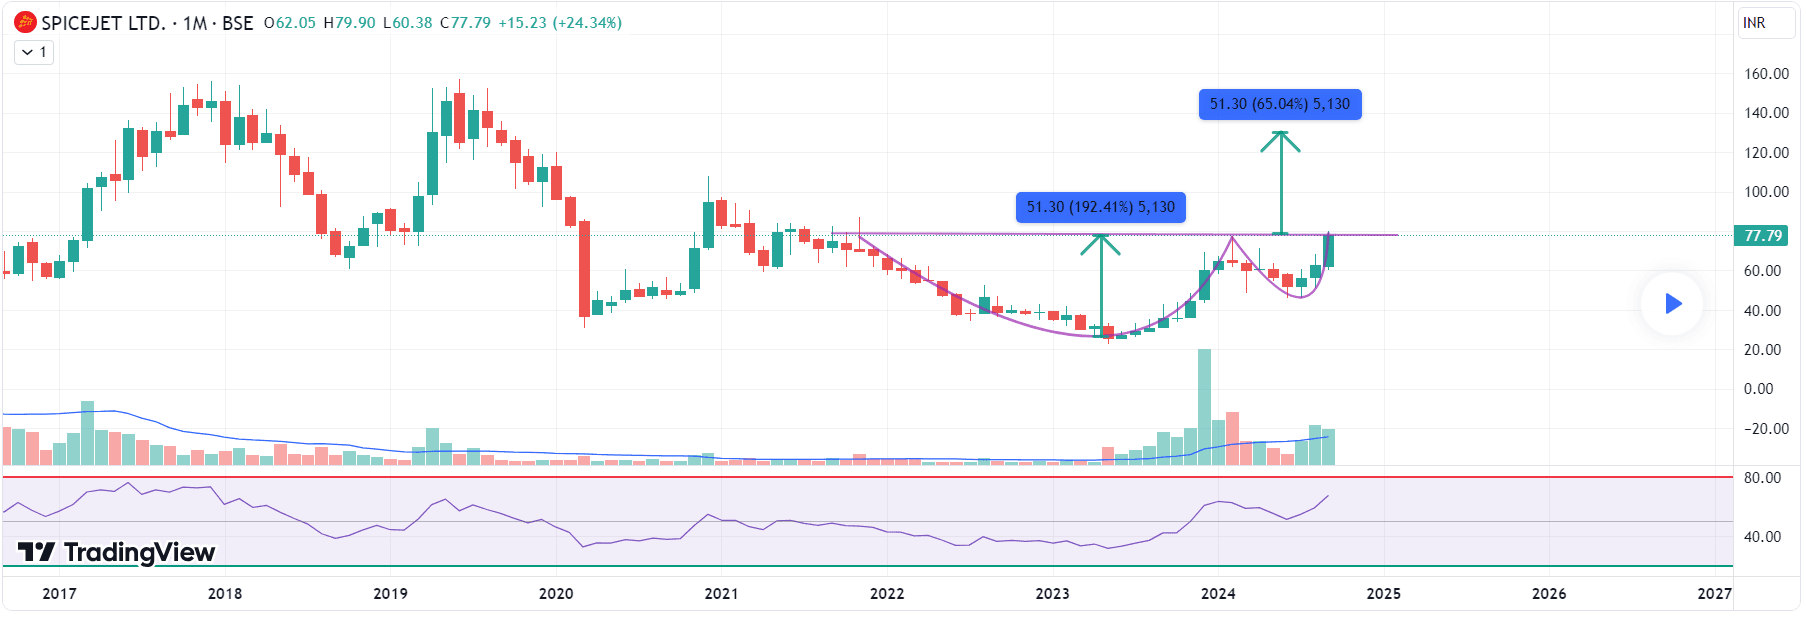
Source: TradingView
In the Spicejet Limited monthly chart, one can observe the formation of a cup and handle chart pattern following a particular downtrend. The price consolidation forming the rounded bottom before the handle (formed by a downside move) is the basing pattern.
The price chart shows that the trading volume during this consolidation phase was very low, thus not reflecting market participants’ commitment toward a particular price direction. The cup and handle pattern shows an impending bullish trend in the above chart. Once the breakout happens, individuals can enter a position to make financial gains from the upside move.
#2 - Flat Base
This pattern typically forms after a significant rise in asset price. The appearance of the flat base takes place in a somewhat downward-sloping or horizontal pattern where the price fluctuations are generally within a tight range of 15%. This formation may last for many weeks or months. As the pattern forms, the asset’s trading volume decreases. One must note that the breakout happens after the price crosses the upper range of the base, preferably with high volume.
Examples
Let us look at a few basing examples to understand the concept better.
Example #1
Suppose David is an experience stock trader who was tracking the price movements of Stock DER. After a strong uptrend, the price of the security started moving sideways as a consolidation phase began. He noticed, based on the price chart and predicted that an uptrend was on the horizon. After trading within a tight range for 2 weeks, the price broke out over the resistance level, i.e., the upper range.
Once he confirmed the breakout by observing the significant increase in trading volume, David placed a buy order above the resistance level. As the bullish trend materialized and the price rose sharply, he was able to make significant financial gains.
Example #2
In the chart below, one can observe that the Nvidia chart shows a basing period between March and May, as shown by a couple of pink parallel lines. A breakout occurred around May 21, 2024. However, a sell-off came after that, which started around June 21, 2024.
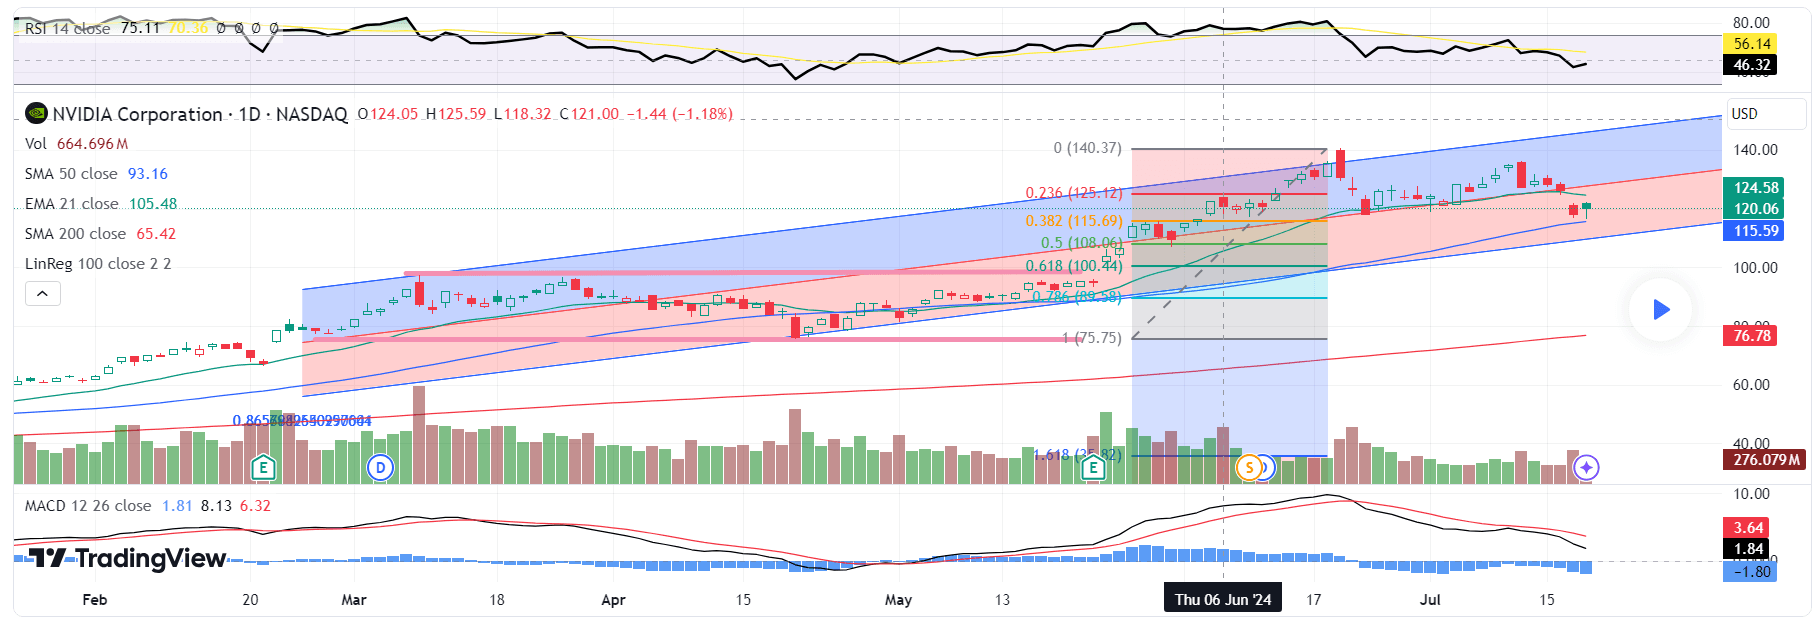
Source: TradingView
The prior breakout’s 38.2% Fibonacci retracement level supported the sell-off. The purple line in the price chart represents the same. The relative strength index of the stock is in a neutral zone, not indicating oversold or overbought conditions. Additionally, the 12-day exponential moving average of the MACD was lower than the 26-day EMA, as shown above.
Overall, it appears the stock was trying to form a new consolidation base before deciding if it was time to break through the $141.40 price level. That said, per analysis the stock could also be forming a double-top pattern, which indicates a bearish reversal.
Pros And Cons
Let us look at the benefits and limitations of this pattern in technical analysis.
Pros
- The consolidation phase indicates stability, which can serve as a positive signal for traders seeking an entry point that is less risky.
- This phase allows traders to take their time to analyze an asset’s price movements and decide whether to purchase, hold, or sell it.
- It indicates that a reversal might be on the horizon and helps traders identify entry and exit points to benefit from the new trend.
Cons
- During the consolidation phase, the trading volume is often lower when compared to the average trading volume. Hence, traders might find it difficult to predict the future price movements.
- Individuals, especially the ones new to the world of trading, might find it challenging to identify the pattern.
- Traders may end up misinterpreting this pattern, which may result in incorrect trades. This, in turn, leads to financial losses.