Table Of Contents
What Is The Average Propensity To Consume?
The average propensity to consume (APC) is the percentage of an individual’s total disposable income spent on purchases. This expenditure is on goods and services and therefore depicts an individual’s spending behavior. APC is expressed as a decimal that ranges between 0 and 1.
A high ACP signifies that an individual spends extravagantly. However, in doing so, the individual contributes massively toward market demand. In contrast, a low ACP signifies low spending and a low contribution toward market demand. The opposite of ACP is the average propensity to save.
Table of contents
- What is the Average Propensity to Consume?
- The average propensity to income (APC) is the ratio of an individual’s consumption and disposable income. It is expressed as a percentage or decimal. In decimals, APC ranges between 0 and 1.
- The fraction reflects the total amount saved by a household, and the same formula can be applied to project a nation’s economy.
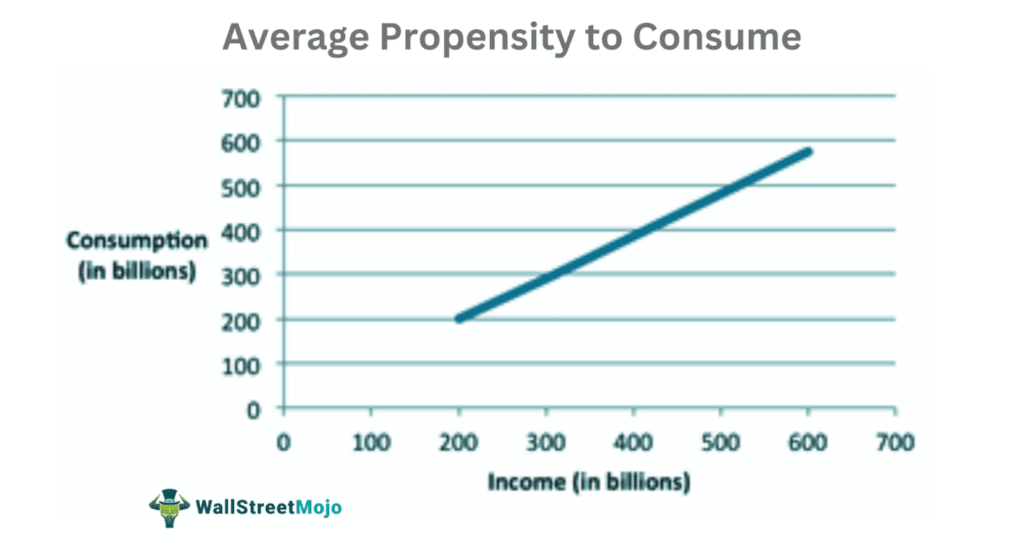
- The APC graph depicts a slope where disposable income is on the x-axis and consumption is on the y-axis.
Average Propensity To Consume Explained
The average propensity to consume (APC) indicates the household expenditures of a country. This metric impacts the nation’s economy in a significant manner. The household income decides the level of consumption, which in turn dictates the market demand for products and services.
A high APC, therefore, indicates that the economy is flourishing. At the opposite end of the spectrum, a low average propensity value signifies a low market demand; the economy is struggling. Technically, the average propensity is calculated as a percentage of expenditure—the percentage of disposable income spent on purchases.
Let us first define disposable income (DI) then. The portion of gross income left with an individual after they clear financial liabilities and taxation is referred to as disposable income. Thus, it is the real income an individual can spend on household needs, purchases, savings schemes, and investments.
Obviously, saving and spending rise when the total disposable income of a nation rises. But, more importantly, when consumer spending increases, it triggers demand. Further, there is an increase in supply, economic activities, and employment generation.
The average propensity concept highlights that demand and cash flow diminish if there is less consumption. If the downtrend continues for longer, it could cause widespread bankruptcy, liquidation, layoffs, and unemployment.
Economists suggest low-income households have higher APC; they are more likely to use their income to pay off debts and buy products against future income. The average propensity to save (APS) is a similar concept; APS is the opposite of APC. A high APS value indicates that the particular household is more into saving than spending.
The marginal propensity (MPC) concept is also related to APC. MPC focuses on a household's additional income and consumption. When an increase in additional income causes an increase in consumption, MPC resembles APC. But when the increase in additional income does not cause an equal increase in consumption, we call it MPC. When this occurs, the graph deviates from APC.
The general idea is that households categorize their incomes into consumption, saving, and expenses. The sum value of the propensity to consume and save with always be equal to 1. The APC from current income is usually considered high. Low-income families fall into the debt trap; they do not always have any other option—they are forced to spend—to meet urgent needs. Borrowing loans they cannot afford is prevalent among low-income households.
Many economists try to derive a nation’s APC using the APC equation for households. This way, they study the spending habits of the nation. Although some economists criticize this generalization, they also believe APC should not be considered an indicator of a nation's economy.
Formula
The formula for average propensity to consume is as follows:
- Average Propensity to Consume = Consumption/Total Disposable Income
- Thus, abbreviated as APC = C / DI
Calculation
Now, let us look at the average propensity to consume calculation.
Jonathan runs a household that consumes $45,000 in a year. The household earns a total of $90,000 in income.
Based on the given values, let us calculate Jonathan’s average propensity.
- APC = C / DI
- APC = $45,000 / $90,000
- APC = 0.50
Further, let us consider a country with an income of $90 billion. This country saved as much as $40 billion in the same period. Thus, the remainder (disposal income) was spent on purchasing goods and services.
Based on the given values, let us calculate the country’s average propensity to save:
- Average Propensity to Save = Total Saving / Total Income
- Average Propensity to Save = $40 Billion/ $90 Billion
- Average Propensity to Save = 0.44
This means the country saves 44 percent of its total income.
Average Propensity To Consume And Marginal Propensity To Consume
Now, let us compare the average propensity to consume and the marginal propensity to consume.
- APC is the ratio of disposable income and consumption. In contrast, marginal propensity to consume (MPC) is determined by dividing additional income by additional consumption.
- The value of APC can never be zero, but the value of MPC can be zero.
- On the consumption curve, the APC can be depicted at any point. On the other hand, MPC is the difference between two points in a curve.

Frequently Asked Questions (FAQs)
In most real-world scenarios, average propensity (APC) ranges between 0 and 1. At 1, all of the income is consumed. If the consumption exceeds income, then APC can be greater than 1, but this is seen rarely.
MPC at a specific income level is the absolute consumption ratio concerning total income. In contrast, APC is the change in disposable income concerning consumption.
If C is consumption expenditure, and DI is total disposable income, then the APC formula is expressed as follows:
APC = C / DI
Recommended Articles
This article has been a guide to what is Average Propensity to Consume. We explain its formula, calculation, and comparison with the marginal propensity to consume. You can learn more about it from the following articles -
