Table of Contents
What Are Asset Management Ratios?
Asset management ratios are calculations that measure the efficacy in the utilization of assets to generate sales and, thereby, revenue. A higher ratio after calculation indicates that a company's efficient use of its assets generates more sales. A lower ratio, on the other hand, indicates the opposite. Additionally, these ratios provide insight into inventory management and collection methodologies.
Applying the same asset management ratios formula for companies in different sectors of business is not an appropriate practice. Different industries might have differences in capital intensiveness inherent in that particular sector of work. Therefore, the interpretation of these ratios is based on historical data, industry norms, and the company's performance.
Key Takeaways
- Asset management ratios are a depiction of a company's efficiency in using its assets to create corresponding or exponential growth in terms of sales or revenue.
- These ratios help top management and stakeholders understand the performance level of the company.
- It can also be used to compare the performances of competitors or other companies within the same industry. Comparing companies in different industries might give misleading results.
- However, the over-reliance on revenue and assets does not give the complete picture.
- The inclusion of profit as a metric might give a more complete picture of the financial performance of the company.
Asset Management Ratios Explained
Asset management ratios are indicators of a company's consumption or usage of its assets to create incremental sales and revenue. A company with a high ratio shows that its assets have been used in an exemplary manner. However, a low ratio could mean that the company is underutilizing its assets.
It is also important to note that a company with a liquidity and asset management ratio that is too high does not mean something other than fantastic use of assets. Overutilization of assets could lead to non-sustainable use of resources, as assets such as machinery are susceptible to wear and tear and might even break down if overutilized.
In its most authentic essence, these ratios give stakeholders a clear idea about the company's ability to transform their assets into optimal levels of sales. It can also allow top management, shareholders, and promotors to gain insights into the effectiveness of asset management.
Asset management ratios can be addressed as asset turnover ratios or even asset efficiency ratios. Irrespective of what terminology is used, these ratios consider only two parameters – revenue and assets.
These ratios can be used to compare the ratios of competitors and other similar companies within the industry. Moreover, different ratios can be used based on the industry and company's asset classes to arrive at the same conclusion, making it a flexible form of calculation.
However, the major setback of these calculations is its inherent nature of considering only sales or revenue. The ignorance of profits could lead to an unclear picture of the company's financial health. For instance, a company could have a high ratio in terms of utilizing assets and have a terrible net profit. Therefore, it is vital to use it in combination with other ratios to get a clearer picture.
Interpretation of Asset Management Ratio
A majority of asset management ratios formulas have sales as the numerator, and assets of different natures act as denominators. As a result, the interpretation of these assets is as follows:
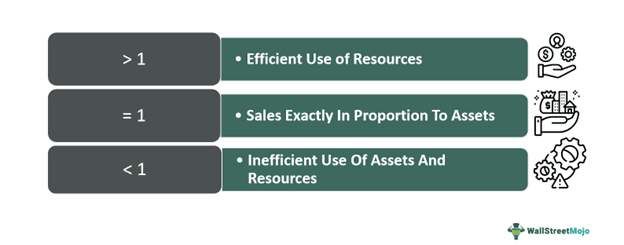
- A ratio between 0-1 shows efficient use of assets to create sales. As such, the ratio of sales is greater than the total value of the company's assets. Therefore, the company is making efficient use of its resources.
- Ratios lesser than 1 can show one of two scenarios. One, it could mean that the assets are not used to its potential. Two, it could also mean that there has been an excessive deployment of assets within the period of calculation.
- A ratio of 1 indicates that the proportion of assets is equal to the quantum of sales. While it might look like an ideal scenario, it is not encouraging for a business to have sales at the same level as its assets.
Types
While there are multiple ratios companies use for liquidity and asset management ratios, a few of the most common ones are as follows:
- Total Asset Turnover Ratio: The total asset turnover ratio elucidates the efficient use of assets for the generation of sales. A better understanding can be attained through the understanding of the formula, which is:
Asset Turnover Ratio = Sales / Average Total Assets
- Fixed Asset Turnover Ratio: As the name suggests, only fixed assets are considered to gauge the efficiency in generating revenue or sales. The formula is:
Fixed Asset Turnover Ratio = Sales / Fixed Assets
- Inventory Turnover Ratio: It is one of the more critical ratios in this regard as it considers the exact number of times a company has restocked and generated sales through their inventory within an accounting period. The formula to calculate these numbers is:
Inventory Turnover Ratio = Net Sales / Inventory
- Net Working Capital Turnover Ratio: Calculation is done only with the consideration of the company's working capital. Even though net working capital provides a better picture of operations than of total assets, some companies prefer it to gauge efficiency. The formula is:
Net Working Capital Turnover = Sales / Net Working Capital
- Days Sales Outstanding: The day's sales outstanding ratio shows how many days it takes for a business to recover its account receivables. The period is calculated in terms of number of days. The formula to calculate these numbers is:
Days Sales Outstanding = (Accounts Receivable / Sales) X 365 (Days)
Examples
Now that the basics and formulae are out of the way, it is time for the theoretical data to be applied to practical applications through the examples below.
Example #1
XYZ Private Limited reported their beginning assets at $105,000 and total assets ending at $100,000. Within the same period, the company records a sale of $250,000.
The calculation of the asset turnover ratio would be as follows:
Asset Turnover Ratio = Net Sales / Average Total Assets
- = $250,000/ ($105,000 + $100,000)/2
- = $250,000 / $102,500 = 2.4390
Example #2
In March 2024, Gopal Snacks, One of India's most prominent traditional snacking brands, was set to launch its IPO. It boasted an 11% annual growth in revenue in the financial year preceding the year of the IPO.
The rapid urbanization of Indian villages and accessibility in terms of knowledge and logistics helped the company multifold in a short period. However, the FMCG space in the sub-continent needs to be lowered, and the margins are minimal.
Despite challenging conditions in the Indian snack market, Gopal Snacks have been able to maintain an impressive 6.86 in terms of their fixed assets turnover ratio in the fiscal year 2022. As a result, they were successfully able to list the company on the stock exchange and raise ₹650 crores through the initial public offering.
How To Improve Asset Management Ratios?
A few methods to improve liquidity and asset management ratios above minimal levels could be:
- Companies looking to improve their efficiency in using their assets must focus on improving their revenue on a regular basis. Production of quality products and meeting all required parameters would account for nothing if it were not converted into corresponding sales.
- Establishing a system for managing inventories could put a lot of functions in place. FIFO or LIFO methods of inventory management can be incorporated based on the nature of the product or industry. These systems shall reduce the turnaround time and increase the efficiency of the production-to-payment cycle.
- Sometimes, businesses end up purchasing extraordinary amounts of assets and underutilize their maximum potential. In such cases, it is better to sell assets that are not necessary and maximize the existing ones.
- A popular solution in the modern day is not to buy assets outright. Instead, businesses lease assets. As a result, their capital investment is cut down to a fraction of the amount if they opt for an outright purchase.
- Establishing a set payment cycle. Fastening the payments in terms of accounts receivables shall give companies an opportunity to rotate funds and maximize their resources through the cashflow. Moreover, the need to pump more cash into the business also gets eliminated if payments are free-flowing.
Advantages and Disadvantages
The application of the asset management ratios formula has a set of advantages and disadvantages. They are:
Advantages
- These ratios asses the company's efficiency in terms of using their resources. As a result, investors, shareholders, and other stakeholders can make decisions according to these numbers.
- The wide range of these assets, such as the fixed asset turnover ratio, accounts receivable turnover ratio, and inventory turnover ratio, help companies interpret the use of different assets. Therefore, a bigger picture can be seen.
- Companies often rely heavily on profits as a parameter to gauge the effectiveness of the efficiency in operations. However, these ratios provide a new perspective on gauging a company's performance.
- It is a fantastic way of comparing a company with its competitors or other companies within the same industry. Sometimes, businesses might have healthy profits but sub-par asset management ratios, or vice versa. Therefore, the comparison in this regard can add perspective.
Disadvantages
- The foremost disadvantage of these ratios is their consideration of only sales and asset values. The elimination of profits does not show the complete picture. Therefore, these numbers can be misleading.
- These ratios tend to ignore if the company is capital-intensive or labor-intensive. As a result, the quantum of assets within these companies might be starkly different. Hence, it might not be the most reliable source of comparison if companies are from different industries.
- The high reliance on financial statements and historical data leads to companies manipulating them to get the ratios more in their favor.
