Table of Contents
What Is Aroon Oscillator?
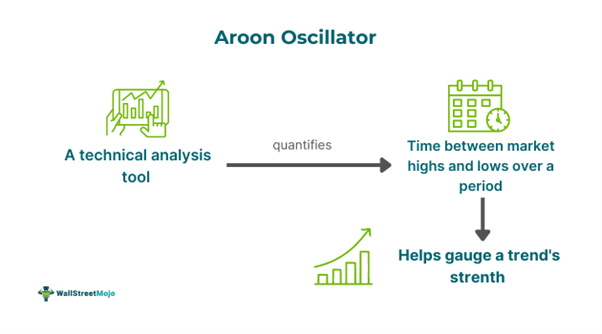
The Aroon oscillator refers to a technical analysis tool that essentially gauges the time between the market highs and lows over different periods. It enables traders to measure a trend’s strength and spot potential reversals. Moreover, the tool also helps figure out when market consolidation is taking place.

Developed by Tushar Chande, this oscillator comprises the Aroon Down indicator and the Aroon Up indicator. It is plotted in the form of a line graph that oscillates between the range of -100 and +100. Values near 100 signal a strong trend. On the other hand, values near 0 indicate a weak trend.
Key Takeaways
- Aroon oscillator is a tool quantifying the time taken by the price of any security to reach the lowest and highest points over a certain duration.
- For Aroon oscillator calculation, one needs to deduct Aroon Down from Aroon Up.
- Two key benefits of this oscillator are its versatility and flexibility. That said, it comes with disadvantages. For example, it can generate false signals and cannot serve as a standalone technical indicator.
- The value of this technical indicator oscillates between -100 and + 100
Aroon Oscillator Explained
The Aroon oscillator is a momentum oscillator that tells whether an asset is trending and gauges that trend’s strength. Traders and analysts can utilize this tool to identify trend reversals and continuation. In other words, they can use this tool to place buy and sell orders. One may also use this oscillator to spot market consolidation.
The oscillator consists of two lines or indicators — Aroon Up and Aroon Down, as noted above. Calculating these two indicators is necessary before one draws the oscillator on a price chart. The Aroon up and down indicators gauge how much time has passed since the asset recorded a 25-day high and a 25-day low, respectively. Generally, the tool uses a 25-period timeframe. That said, note that one may use the Aroon oscillator trading strategy with any period, as the timeframe can be subjective.
Utilizing more periods leads to the formation of a smooth indicator with fewer waves. On the other hand, utilizing fewer periods garners more waves along with a relatively quick turnaround.
The lows and highs utilized in the calculation of the two indicators (Aroon Down and Aroon Up) lead to an inverse relation between them. Simply put, when the value of Aroon Up increases, that of Aroon Down decreases and vice versa.
How To Read?
When this oscillator cuts the zero line and moves below it, a bearish reversal might occur. In other words, it is a bearish sign. On the flip side, when this oscillator cuts the zero line, moving above, it is a bullish sign.
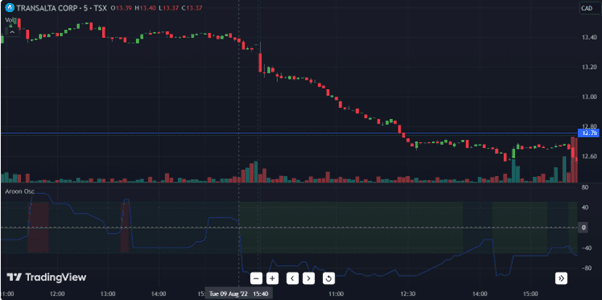
Let us look at the following TradingView chart of TransAlta Corp to understand the interpretation.

As one can observe, the price was consolidating until 3:40 pm on Aug 09, 2022. When the Aroon Oscillator (blue line) crossed the zero line from above, the price fell sharply in the following trading sessions, and a downtrend materialized.

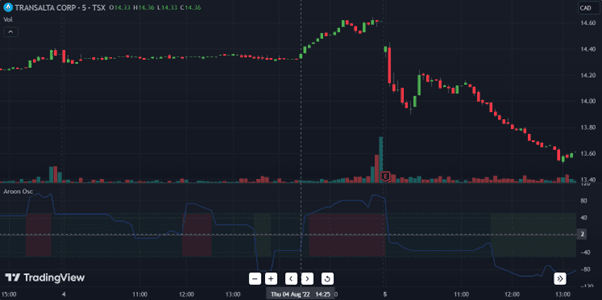
Conversely, in the above chart, we can see that when the blue line crossed the zero line from below and moved upward, the price gained bullish momentum an uptrend materialized for a short period.
As noted above, this tool can also help gauge trend strength. If this blue line is above 50, the uptrend is strong. That said, the downtrend is strong if the line is below -50. We can observe this in the above chart. On Aug 5, around 1 pm, the oscillator was below -90, and the price chart exhibited a strong downtrend.
How To Trade?
One use the following strategies to trade this oscillator:
#1 - Trend Following
This Aroon oscillator trading strategy involves entering a long position when the positive value of this oscillator signals an uptrend. Conversely, it involves entering a short position when the negative value of the oscillator signals a downtrend.
#2 - Trend Reversals
With the help of this tool, traders can spot trend reversals and execute trades accordingly. For example, traders can enter a long position when the oscillator cuts the zero line and moves downward from above. On the contrary, they can enter a short position when the oscillator cuts the zero line on the price chart from above and moves downward.
Formula
Let us look at the Aroon oscillator formula.
Aroon Oscillator = Aroon Up – Aroon Down
Where:
- Aroon Down = (N – Number of Periods Since the 25-Period Low)/N x 100
- Aroon Up = (N – Number of Periods Since the 25-Period High)/N x 100
Here, N is the timeframe.
As noted above, typically N is 25
Examples
Let us look at a few Aroon oscillator examples to understand the concept better.
Example #1
In this Aroon oscillator calculation example, let us consider 5 periods.
The highs given are 2, 5, 7, 9, and 11. On the other hand, the lows given are 1, 2, 3, 4, and 5.
So, Aroon Up = (5 – 0)/5 x 100, i.e. 100
Aroon Down = (5-0)/5 x 100, i.e. 100
Now, one can use the Aroon oscillator formula shown above to get the required value.
Arron Oscillator = 100 – 100, i.e., 0
This means the trend is neutral.
Example #2
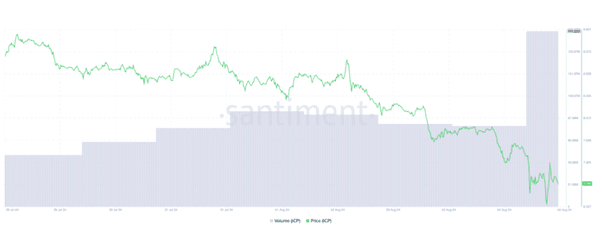
According to a report published on August 5, 2024, an altcoin named Internet Computer Blockchain recorded a 14% decline along with a significant rise (more than 110%) in trading volume. The divergence between the volume and price suggested that a lot of market participants are offloading the assets actively, pushing the price downward.

The cryptocurrency’s Aroon oscillator at the time of writing the report confirmed the strength of the downtrend as the Aroon Dow Line was at 100% then.
Benefits
The advantages of using the Aroon oscillator trading strategy are as follows:
- The oscillator is easy to understand. Hence, it is suitable for even novice traders.
- One can use it with different timeframes, which makes it flexible.
- The tool is versatile as one utilize it with other technical indicators.
Limitations
This oscillator comes with a number of disadvantages. Let us look at them.
- Since the tool is a lagging indicator, it may fail to provide signals in real time.
- This oscillator often generates false signals in sideways and choppy markets.
- One cannot solely rely on this indicator.
For professional-grade stock and crypto charts, we recommend TradingView – one of the most trusted platforms among traders.
Disclosure: This article contains affiliate links. If you sign up through these links, we may earn a small commission at no extra cost to you.

