Table Of Contents
Difference between Anova and T-test
The key difference between ANOVA and T-test is that ANOVA is applied to test the means of more than two groups. In contrast, a t-test is only used when the researcher compares or analyzes two data groups or population samples. Also, in ANOVA, the dependent variable should be continuous, and the independent variable should be categorical and have three or more levels or categories. In the t-test, the dependent variables should be continuous, and the independent variable should be categorical and have two levels. These are some of the significant points explaining ANOVA vs. t-test.

Key Takeaways
- In ANOVA vs. t-test, the key difference is that ANOVA is applied to test the means of more than two groups, whereas the t-test compares or analyzes the means of two groups.
- It answers when to use ANOVA and t-test and what is the difference between ANOVA and t-test.
- In one-way ANOVA vs. t-test, the independent variable of one-way ANOVA should be categorical and have three or more levels or categories.
- In the t-test, the independent variable should be categorical and have two levels.
- Both methods share similarities like both are statistical methods used to test hypothesis and compares the mean values of samples etc.
Comparative Table
| Particulars | ANOVA | T-Test |
|---|---|---|
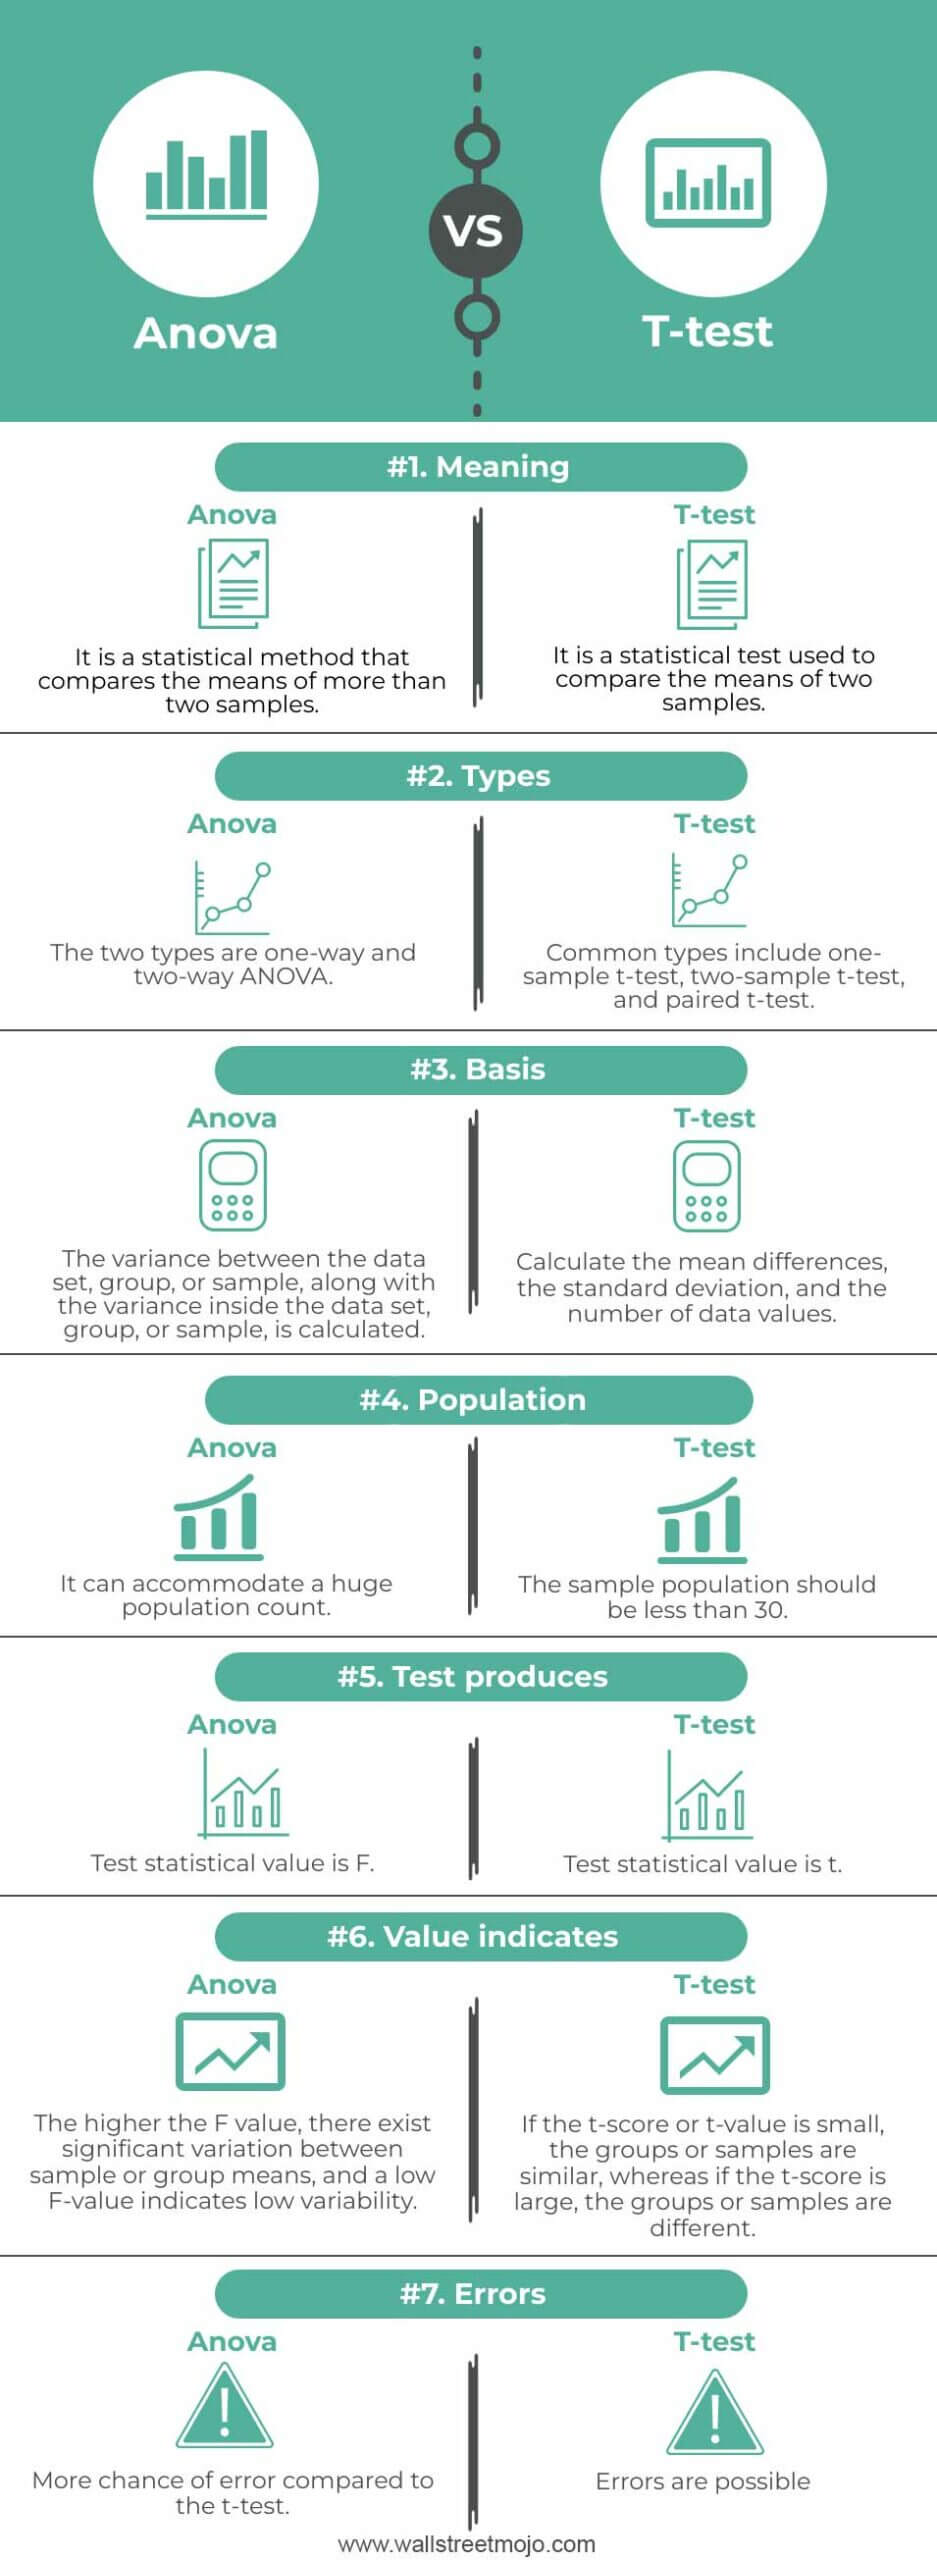
| 1. Meaning | It is a statistical method that compares the means of more than two samples. | It is a statistical test used to compare the means of two samples. |
| 2. Types | The two types are one-way and two-way ANOVA. | Common types include one-sample t-test, two-sample t-test, and paired t-test. |
| 3. Basis | The variance between the data set, group, or sample, along with the variance inside the data set, group, or sample, is calculated. | Calculate the mean differences, the standard deviation, and the number of data values. |
| 4. Population | It can accommodate a huge population count. | The sample population should be less than 30. |
| 5. Test produces | Test statistical value is F. | Test statistical value is t. |
| 6. Value indicates | The higher the F value, there exist significant variation between sample or group means, and a low F-value indicates low variability. | If the t-score or t-value is small, the groups or samples are similar, whereas if the t-score is large, the groups or samples are different. |
| 7. Errors | More chance of error compared to the t-test. | Errors are possible. |
What is Anova?
In ANOVA vs. t-test, Analysis of Variance (ANOVA) is a statistical method used to test the difference among means. It is commonly used when the data samples or groups are more than two, and the means of both groups are calculated to take the analysis further. Also, the researchers test the null hypothesis (H0) and alternative hypothesis (Ha) by comparing the mean values. It is generally categorized into one-way ANOVA and two-way ANOVA.
ANOVA test calculation uses F-distribution and portrays the comparison between group variance and within the group variance. First, the ANOVA coefficient F or F-statistics is determined by dividing the mean sum of squares due to treatment by the mean sum of squares due to error. Then, the F statistics are compared to the critical F value obtained from the F table to get relevant information. If the F-ratio is close to 1, no true variance exists or no meaningful difference between the groups, and the null hypothesis is true.
An example scenario where the ANOVA can be applied includes the analysis of the impact of exercise type on weight loss. In this case, exercise type is the factor or independent variable, which is categorical, and its different type forms the levels or categories of the independent variable. On the other hand, weight loss is the continuous dependent or response variable. The application of ANOVA determines whether there is a statistically significant difference in mean values. Altogether, contributes to the points explaining ANOVA vs. t-test.
What is a T-test?
The t-test is the statistical test used to examine whether there is any difference between the means of two groups. The test assumption includes the normal distribution of the samples or groups. In addition, the observations in the sample should be independent of each other, the samples should be the outcome of a random sampling method, and the two samples should have the same variance. Furthermore, another type of t-test is paired t-test, and ANOVA vs. paired t-test indicates that paired t-test is used when the two samples are correlated. It is also a common comparison other than ANOVA vs. t-test.
In the t-test, the null hypothesis takes the form of H0: µ(x) = µ(y) against the alternative hypothesis Ha: µ(x) ≠ µ(y); here, µ(x) and µ(y) represent the sample or group means. The null hypothesis states that there is no difference in mean values, and the alternative hypothesis indicates the existence of a difference in mean values. The test helps to provide evidence for alternative hypotheses or reject the null hypothesis. It also tells whether the two data sets are samples taken from the same population or not. Examining ANOVA vs. t-test, it is also evident that both methods require the accurate formation of the null and alternative hypotheses.
Anova vs. T-test – Infographics
Similarities
- Both ANOVA and t-test are statistical methods used to test hypotheses.
- Both methods compare the means of groups.
- Both methods share similar assumptions, like the continuous nature of the dependent variable and normally distributed population. All these similarities also help in examining the ANOVA vs. t-test concept thoroughly.
