Table Of Contents
ANOVA (Analysis Of Variance) Definition
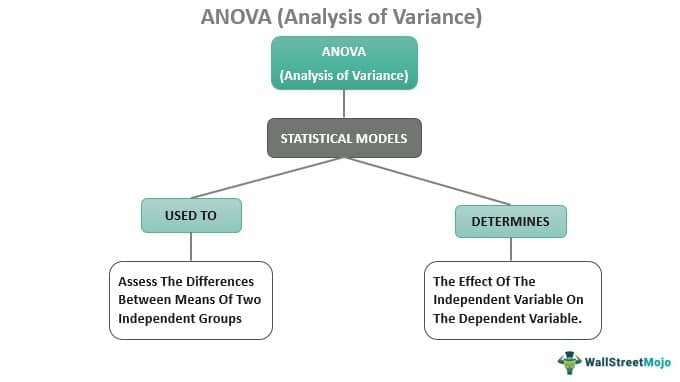
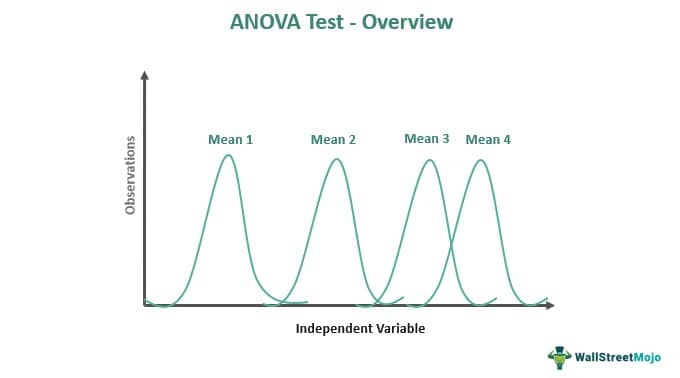
ANOVA (Analysis Of Variance) is a collection of statistical models used to assess the differences between the means of two independent groups by separating the variability into systematic and random factors. It helps to determine the effect of the independent variable on the dependent variable.

Figure 1. ANOVA (Analysis of Variance)
It is useful in finding the impact of different factors on the movement of stock fluctuations. As a result, statisticians, economists, or analysts do an in-depth analysis of the security index under various market conditions with its help. Moreover, the ANOVA test helps determine the significance or randomness of the results of an experiment.
Key Takeaways
- ANOVA is statistical tool analysts use to find the difference between the means of two independent groups. One finds it by dividing the mean sum of squares between the groups from the mean squares of errors.
- There are three major assumptions of Analysis of Variance they are the following - normally distributed population, homogenous variance, and independently drawn samples.
- There are three types of ANOVA tests- One-Way Analysis of Variance, Two-Way Analysis of Variance & N-Way Analysis of Variance (MANOVA).
- If the p-value is less than 0.05, the analysts reject the ANOVA test and vice versa.
- Statisticians and Economists use the Analysis of Variance test only when there is either one category of the independent variable that has more than one type and data related to the dependent variable has been collected.
ANOVA Formula
The formula for Analysis of Variance is:
ANOVA coefficient, F= Mean sum of squares between the groups (MSB)/ Mean squares of errors (MSE).
Therefore F = MSB/MSE
where,
Mean squares between groups, MSB = SSB / (k – 1)
Mean squares of errors, MSE = SSE / (N – k)
And
Total degrees of freedom, N – 1= df3
Degrees of freedom of errors, N – k = df2 here, N is the total number of observations throughout k groups.
Degrees of freedom between groups, k – 1= df1, where k is the number of groups.
Moreover, the ANOVA table below represents its many components:
| Source Of Variation | Sum Of Squares | Degrees Of Freedom | Mean Squares | F Value |
|---|---|---|---|---|
| Between Groups | SSB = ∑ nj (X̄j - X̄)2 | df1 =k - 1 | MSB = SSB / (k-1) | f = MSB/MSE |
| Error | SSE =∑∑ (X- X̄j)2 | df2 = N - k | MSE = SSE / (N-k) | |
| Total | SST = SSB + SSE | Df3 = N - 1 |
Table 1. ANOVA test table
For the above table, the following represents:
SSB = sum of squares between groups
SSE = sum of squares of errors
X̄j - X̄ = mean of the jth group,
X- X̄j = overall mean, and nj is the sample size of the jth group.
X = each data point in the jth group (individual observation)
N = total number of observations/total sample size,
and SST = Total sum of squares = SSB + SSE
If the value of F is near about 1, then there is insignificant variance between the means of the two groups of data set under observation.
Analysis of Variance Assumptions
Here are the three important ANOVA assumptions:
- Normally distributed population derives different group samples.
- The sample or distribution has a homogenous variance
- Analysts draw all the data in a sample independently.
ANOVA test has other secondary assumptions as well, they are:
- The observations must be independent of each other and randomly sampled.
- There are additive effects for the factors.
- The sample size must always be greater than 10.
- The sample population must be uni-modal as well as symmetrical.
Types of Anova Tests
There are three types of ANOVA tests:
#1 - One Way ANOVA
One way ANOVA analysis of variance is commonly called a one-factor test in relation to the dependent subject and independent variable. Statisticians utilize it while comparing the means of groups independent of each other using the Analysis of Variance coefficient formula. A single independent variable with at least two levels. The one way Analysis of Variance is quite similar to the t-test.
#2 - Two Way ANOVA
The pre-requisite for conducting a two-way anova test is the presence of two independent variables; one can perform it in two ways –
- Two way ANOVA with replication or repeated measures analysis of variance – is done when the two independent groups with dependent variables do different tasks.
- Two way ANOVA sans replication – is done when one has a single group that they have to double test like one tests a player before and after a football game.
Moreover, one must meet the following conditions for its applications:
- The population should be near normal distribution.
- All samples should be independent.
- Variances of the population have to be equal.
- There should be an equal-sized sample in the group.
#3 - N-Way ANOVA (MANOVA)
It applies to multiple independent variables that affect the dependent variable. It is more effective than Analysis of Variance as one can use it to observe multiple dependent variables simultaneously.
Example
Here is an Analysis of Variance example to understand the concept better.
Let us assume that researcher ‘G’ is researching the type of chemical fertilizer and density of planting crops that will give the best yield of crops in a field-based experiment for a one way analysis of variance. So, for the experiment, G assigns multiple plots within a field to a permutation and combination of three types of fertilizers – 1,2 & 3 along with planting density as A= low density, B= high density. Also, G carves four blocks in the field, namely – 1,2,3 & 4. Therefore, G measures the final yield of crops as bushels per acre at harvest time.
One could use the two-way ANOVA test to determine whether the two independent variables – a type of fertilizer and planting density- affect crop production output. Furthermore, one uses three testing models where –
Model 1 – assumes an interaction between independent variables.
Model 2 - assumes there is an interaction between independent variables; and
Model 3 – assumes that the bocking variable affects the data variation upon the interaction of independent variables.
After the ANOVA test, one observes the following results:
- One observes an increase in the yield of crops under fertilizer 3 and high densities of crop planting.
- One sees no effect on the crop yield when the crop’s fertilizer and density interact.
Likewise, statisticians use a one-way ANOVA test to deduce the relationship between the finish time of a marathon race, the brand type of shoes used to like- Hoka, Adidas, Nike, and Saucon, or other economic & statistical variables.
Interpretations
Analysts can interpret the results of the ANOVA test as the following:
The most significant value in the ANOVA test is the p-value. Moreover, the ANOVA test uses the following hypothesis – null hypothesis and alternative hypothesis.
The null hypothesis H0 means that all the means of groups are equal. And the alternative hypothesis HA means that the means of the group are not equal. Moreover, when the p-value is less than 0.05, analysts will reject the null hypothesis from one-way ANOVA. If the p-value is more than 0.05, then the null hypothesis of Analysis of Variance is accepted. If analysts reject the null hypothesis, then all the means of the group are not equal.
When To Use?
One should use the ANOVA test when one collects the data for one category of an independent variable having three different types and the data for contextual dependent variable too. Then, analysts use it to know the effect on the dependent variable concerning the change in the independent variable.

For instance, if one has to use the Analysis of Variance test to find the effect of social media use on the users’ sleep, then one has to assign three types - low usage, medium usage, and high usage to the social media variable. Only then is it possible to find contrast in the sleeping pattern of the users.

