Table of Contents
What Is Alligator Indicator?
Alligator Indicator is widely used in technical analysis, in which traders identify price trends in the market. Bill Williams invented it based on his analysis that markets trend on 15% to 30% of the time. Other times, it follows a range.
This indicator successfully identifies trends that can be used for profitable trades and avoids ranges that may lead to losses. It involves complex calculations that can be used to denote ideal entry and exit points in a trading session.
Key Takeaways
- Alligator indicator is a method of technical analysis that Bill Williams invented.
- According to this indicator, the market follows a trend only 15% to 30% of the time. Other times, it is only rangebound.
- This indicator is ideal for understanding buy and sell points that will help in taking profitable trades.
- The calculation involves three kinds of moving averages, which use convergence and divergence to create trading signals within the chart.
Williams Alligator Indicator Explained
Williams Alligator indicator is a concept used in technical analysis, where the traders use it to detect market trends that, according to the concept, stay in the market 15% to 30% of the trading sessions, the rest being range bound market.
The concept explains that any individual or financial institution will actively trade during these trending times to take maximum advantage of the market price movements to earn profits. The indicator is calculated based on moving averages, which gives rise to convergence and divergences, creating trend lines of different colors, called Jaws, Teeth, and Lips, that are used to make trade decisions.
The trend formations in the stock alligator indicator act as a guide to understanding the entry and exit points, presenting essential data that is widely accessed for different financial instruments and which gives a clear idea about the market sentiments and behavior.
Each line has its meaning and involves complex calculations. The trader must understand the concept well before using it to frame the market strategy. However, it does not prove to be very useful if the market is highly volatile and there is no proper trend. Therefore, it is advisable to use it in combination with other indicators to get better confirmation.
Calculation
The alligator indicator formula is complex and involves moving averages. The entire process has three parts: jaws, teeth, and lips, represented by blue, red, and green lines, respectively, which indicate the trends.
The jaws show 13-period moving averages, which an 8-period moving average offsets. Next, the teeth show an 8-period moving average that is offset by a 5-period moving average. Finally, there is a 5-period moving average, offset by a 3-period moving average.
However, the alligator indicator formula for the simple moving average calculation is given below.
- SUM1 = SUM (CLOSE, N)
- SMMA1 = SUM1/N
- Subsequent values are:
- PREVSUM = SMMA(i-1) *N
- SMMA(i) = (PREVSUM-SMMA(i-1) + CLOSE(i))/N
Where,
- SUM1= summation of the closing prices of the financial instrument for N number of periods.
- PREVSUM= smoothed sum of the previous bar
- SMMA1= smoothed moving average of the first bar of the financial instrument.
- SMMA(i)= smoothed moving average, excluding the first bar
- CLOSE(i)= current closing price of the financial instrument.
- N= smoothing period
When these lines move away from each other and trend in a particular direction, it suggests whether the market is moving up or down. An uptrend ensures long positions or buy signals, and a downtrend indicates sell signals or short positions. It is better not to take any trade when the lines cross each other because it shows that there is not much activity in the market.
Interpretation
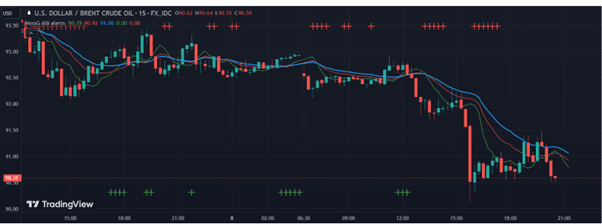
It is possible to explain the concept and best settings for alligator indicator using the TradingView chart. In the chart below, straightforward entry and exit points are visible, which traders will use to make trades. The moving average lines enhance the confirmation of the trend, and traders can backtest their strategies.
The points or levels where the price goes above the moving average lines indicate that an uptrend is possible in the near future and are the prices that are suitable for entering into a long position. In contrast, a downtrend may occur when the prices move below the moving average line, and the trader may take a short position of selling off the asset.
In the chart below, wherever a trend is established, the green line is moving in the same direction as the red and blue. Additionally, it crosses upwards from below for the up move and downwards from above for a down move.
In this case, the trader can use this indicator for assets that may be very fluctuating but have good price movements and trends. It is essential to select the assets properly whose reward-risk ratio is high because they will give good returns using this strategy.
How To Use In Forex Trading?
In order to trade in the Forex market using this indicator, a few steps are involved in understanding alligator indicator.
Step #1 – The first step is to select which currency pair will be used for trading purposes. This requires continuous monitoring of the forex market and identifying the pair that has shown a strong trend recently and has the possibility of carrying on the same in the future.
Step #2 – It is necessary to identify alligators that are currently not under much trend or movement but have the potential to show it. They are sleeping alligators who will show a strong trend very shortly, creating opportunities for successful trades.
Step #3 – According to the indicator, as soon as the green line cuts the red and blue line, both of which are moving in the same direction, a trend is established, which may be an up move or a down move.
Step #4 – The trend direction is the next point that the trader has to identify. If the green line moves in the same direction as the red and blue and moves above both, there is an uptrend. All three are in the same direction, but the green line moves below the red and blue lines, which is a downtrend.
Step #5 – Finally, the trader has to use the best settings for alligator indicator to place the order. An uptrend will mean a long position or buy order, and a downtrend will mean selling off the asset or taking a short position.
Step #6 – It is better to hold on to the trade till the lines are away from each other. A crossing means the trend will reverse now, and the order should be closed.
Examples
Here are some interesting examples to understand the concept of stock alligator indicator.
Example #1
Jacob has identified an alligator indicator for the stock of ABC Ltd, where the green line has just crossed the red and blue moving average line from below. This indicates a possible uptrend very soon. However, Jacob does not only go by this indicator but also checks the MACD and the RSI, which also gives a positive signal for an uptrend. This supports his view of an entry decision onto the stock after waiting for a green bullish candle immediately after the positive crossover.
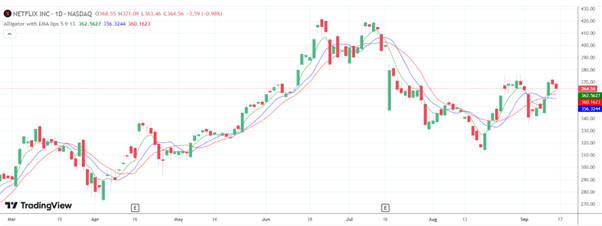
Example #2
Here is an example of Netflix Inc.'s daily chart in NASDAQ. It is clearly seen that wherever the green line crosses the red and blue lines and moves up, an uptrend will take place for the subsequent few trading sessions. The opposite happens when the crossover is downwards. Therefore, this chart shows the indicator very clearly.
Limitations
Some limitations of the concept are given below:
- The signals of stock alligator indicator are not always generated on time. This is because it covers multiple timeframes, and thus, the signals get delayed.
- The indicator only calculates the moving averages for trend determination. It does not account for the factors that influence entry and exit signals.
- It is not a standalone indicator. It has to be used in combination with others so as to get a firm confirmation and take a trade confidently.
- Sometimes, the signals while understanding alligator indicator may be false and misguide the trader because the market may be too volatile.
- An awakening alligator signal may not always provide successful trades.
For professional-grade stock and crypto charts, we recommend TradingView – one of the most trusted platforms among traders.
Disclosure: This article contains affiliate links. If you sign up through these links, we may earn a small commission at no extra cost to you.

