Table Of Contents
What Is Advance-Decline (A/D) Line?
Advance-decline line or A/D line refers to a technical indicator plotting the difference between the total number of declining and advancing stocks daily. People who want to measure the total number of individual stocks can utilize this tool. It shows market sentiment, telling one if more stocks are falling or rising.

The advance-decline line indicator helps prospective and existing investors to analyze and judge the market’s overall performance as it demonstrates indices’ movements through the analysis of individual securities. Moreover, it offers an overview of trades on a daily basis, helping investors get a clear view of the market scenario. Besides these, it can disclose divergence in a market.
Table of contents
- What Is Advance-Decline (A/D) Line?
- The advance-decline line refers to an indicator demonstrating the stock market’s volume or magnitude. It is a reflection of the cumulative number of securities rising or declining over a duration.
- Investors can use this indicator to analyze and assess the overall performance of a stock market.
- A key difference between the A/D line and the TRIN is that the former is utilized as a long-term technical indicator while the latter is suitable for the shorter term.
- One requires three values – advancing stocks, prior net advances, and declining stocks for advance-decline line calculation.
Advance-Decline Line Explained
The advance-decline line refers to a stock market indicator depicting the degree of stock participation in the fall or rise of a market on an individual level. Individuals can utilize this technical indicator to confirm a price trend in crucial indices. Moreover, it can give a warning of a reversal if divergence occurs. This indicator is cumulative; it involves summing up a positive number with the prior number. That said, in the case of a negative number, one subtracts it from the previous year.
If indices move upward yet the A/D line slopes downwards, the market could be losing its breadth, and it might be about to move in the opposite direction. One must note that if the A/D line’s slope is upward while the market trends downward, the market is considered healthy.
On the flip side, if indices keep moving lower while the A/D line turns upward, it may indicate that sellers in the market are losing conviction. If markets and the A/D line trend lower, declining prices will likely continue.
On account of the capitalization-weighted indices, for example, the NASDAQ Composite and S&P 500, stocks having a high market capitalization exert a disproportionate impact on an index’s performance. As such, ADL offers investors an indication concerning the participation of every stock constituting an index in the market’s direction.
For instance, let us say any capitalization-weighted stock index surged 4%. Investors would need to know if the increase in that index was because most stocks surged or if an impressive performance delivered by an organization having a significant weight on that index drove the rise.
Formula
One can use the following formula for advance-decline line calculation:
A/D Line = Previous Net Advances – Declining Stocks + Advancing Stocks
Where:
- ‘Advancing stocks’ are the total number of stocks that surged in value daily.
- ‘Declining stocks’ are the total number of stocks that dropped in value daily.
- ‘Previous net advances’ is the net amount of daily declining and advancing stocks.
Examples
Let us look at a few advance-decline line examples to understand the concept better.
Example #1
Suppose an investor named Sam wants to establish the advance-decline line for a certain index over a specific duration. He has the following details with him:
| Particulars | First Day | Second Day | Third Day | Fourth Day | Fifth Day |
|---|---|---|---|---|---|
| Total Number of Stocks Advancing | 65 | 30 | 46 | 35 | 55 |
| Total Number of Stocks Declining | 15 | 50 | 34 | 45 | 25 |
| Number of Stocks Constituting The Index | 100 | 100 | 100 | 100 | 100 |
The A/D line from the first day to the fifth day will be as follows:
- First day = 65 - 15 = 50
- Second day = 30 – 50 + 50 = 30
- Third day = 46 - 34 + 30 = 42
- Fourth day = 35 – 45 + 42 = 32
- Fifth day = 65 – 35 + 32 = 62
Example #2
According to the founder of Fairlead Strategies, Katie Stockton, the market flashed a bullish signal in June 2023, indicating that the ongoing stock price rally was sustainable and had additional upside ahead. She showed that the S&P 500 index closed higher for five weeks in a row.
Moreover, she pointed out that this came with a confirmed breakout in the New York Stock Exchange cumulative advance-decline line. This was something that they were seeking to affirm the breakout’s strength in crucial indices. It indicated expanding market breadth, which could contribute to the uptrend’s sustainability.
Chart
One can look at the chart below to get a better idea regarding this concept.
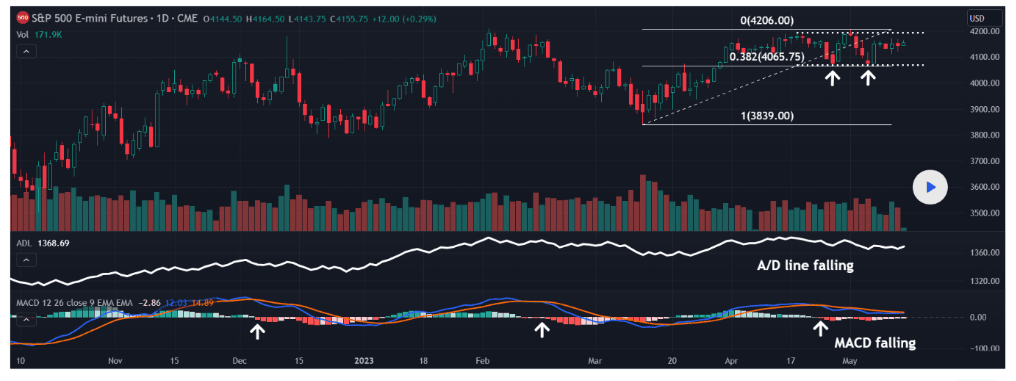
From the above chart, individuals can observe that the S&P 500 is forming a tight range. In this case, there are two bearish points to note.
- The high recorded on May 1, 2023, was higher than the peak on April 18, 2023. The prices could not clear the resistance and dropped back into that range. That was a potentially bearish false breakout.
- The A/D lie appears to be moving downwards for nearly a month, which suggests that more stocks are participating.
How To Read?
Individuals plot this line against a relevant index, which helps them conform trends and the possibility of reversals. Let us look at a few interpretations of this technical indicator in TradingView.

#1 - Both The A/D Line And The Index Are Trending Downwards
The chart above shows the A/D line of NYSE Arca which is an Exchange Traded Product. It is showing a bearish signal whenever the index is falling. The index’s decline results from a fall in the value of most stocks constituting the index.
#2 - Both The A/D Line And The Index Are Trending Upwards
Similarly, the above chart is also showing a bullish signal because the A/D line is rising whenever the index is rising. The price increase of most stocks constituting the index drives the index’s rise.
#3 - The A/D Line Trends Upwards While The Index Trends Downwards

In the chart above, between November and December, the index slopes downwards significantly, but the A/D line is comparatively in a lesser downward trend. When this happens, it is a bullish divergence. The index’s fall results from a decline in the value of a small number of stocks in that index. Hence, it gives an indication of sellers losing conviction.
#4 - The A/D Line Trends Downwards While The Index Trends Upwards
A scenario where the A/D line trends downwards while the index trends upwards are called a bearish divergence. The index’s rise results from the increase in the value of a small number of stocks constituting the index. Hence, it gives an indication that the buyers are losing conviction. As such, the investors have a tendency to believe that the stock market will demonstrate a reversal and a downward trend soon. In the chart of Bitcoin given below the Index is clearly trending upwards, whereas the A/D line is downwards.

Limitations
The A/D line does not always offer accurate readings with regard to NASDAQ stocks. The reason behind this is that NASDAQ frequently lists small speculative companies, out of which several eventually get delisted or fail. When an exchange delists a stock, the security stays in the A/D line’s prior computed values. This impacts future computations, which are then summed up with the cumulative prior value. On account of this, the A/D line sometimes decreases for extended durations, even if the indices related to the NASDAQ keep rising.
Individuals must also remember that there are some market capitalization-weighted indices, which means the bigger a company, the more effect it will have on an index’s movement. This technical indicator gives the same weight to every stock. Hence, it is an improved measure of small to mid-cap stocks, not the large-cap ones.
Difference Between The A/D Line And Arms Index (TRIN)
Let us examine the key differences between the advance-decline line indicator and the Arms Index (TRIN).
- Typically, traders utilize the A/D line as a long-term indicator, while individuals use TRIN as an indicator for a shorter term.
- The A/D line shows how many securities are falling and increasing in value over time. On the other hand, the Arms Index measures the ratio of advancing stocks to advancing volume.
For professional-grade stock and crypto charts, we recommend TradingView – one of the most trusted platforms among traders.
Disclosure: This article contains affiliate links. If you sign up through these links, we may earn a small commission at no extra cost to you.

Frequently Asked Questions (FAQs)
This technical indicator used in the stock market enables existing and prospective investors to measure the difference between the average number of advancers on a daily basis and the total number of decliners of a sector or an index over the past ten days of trading.
An A/D line is a tool utilized by investors to conduct technical analysis of securities. On the other hand, market indices, for example, the S&P 500, refer to a given portfolio that comprises investment holdings representing a financial market’s segment. It tracks the performance of a specific group of securities. The A/D line helps in analyzing the performance of such indices.
Yes, one must remember that there are four variations on this technical indicator.
It can help investors and traders time the market and catch a specific stock price. Moreover, this tool enables individuals to predict price movements of stocks on the downside or upside, helping the market participants position trades effectively.
