Table of Contents
How to Calculate?
To calculate the Expected return, we can use the Capital Asset Pricing Model (CAPM). The following is the equation for the model:
Er = Rf + β (Rm - Rf)
Here, Er = Expected return in the security, Rf = risk-free rate, generally the rate of a government security or savings deposit rate, β= risk coefficient of the security or the portfolio in comparison to the market, Rm= Return on the market or an appropriate index for the given security such as S&P 500.
- Once we already have the expected return, we subtract the same from the actual return to calculate Abnormal return.
- When the portfolio or security has underperformed the expectations, the Abnormal return will be negative. Otherwise, it will be positive or equal to zero, as the case may be.
As per the prudent approach, it is better to take a look at the risk-adjusted return. This is in keeping with the concept of risk tolerance because otherwise, the portfolio manager may deviate from the IPS goals and take up highly risky investments to generate Abnormal returns.
In the case of multiple periods, it may be helpful looking at the standardized returns to see if the portfolio is constantly beating the benchmark. If this is the case, then the standard deviation of the Abnormal return will be lower, and then we can say that the portfolio manager has genuinely made a better stock selection than the benchmark.
What Is Abnormal Return?
Abnormal Return is defined as the increase or decrease in the returns with respect to the estimated profits or losses. It is the difference between the actual return for a stock or a portfolio of securities and the return based on market expectations in a selected time period.
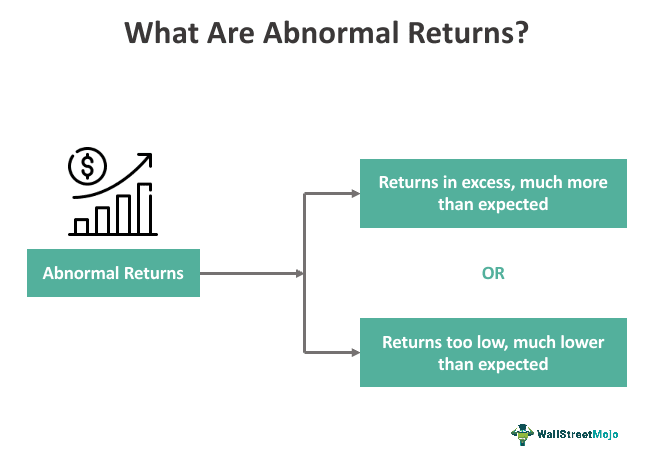
Abnormal return is a key performance measure on which a portfolio manager or an investment manager is gauged. It is confused with excess returns, which is completely unjustified as the latter is concerned with implementing good strategies to uplift returns. On the contrary, abnormal increase or drop in returns indicate manipulation.
Key Takeaways
- Abnormal returns represent the deviation between an investment's actual and expected returns. Investors utilize them to assess an investment's performance relative to the overall market or a benchmark.
- Abnormal returns can be either positive or negative. Positive abnormal returns indicate that the investment has outperformed expectations, while negative abnormal returns indicate underperformance.
- Abnormal returns play a crucial role in investment decision-making and portfolio management.
- Abnormal returns provide valuable insights into the effectiveness of investment strategies and the overall efficiency of financial markets, aiding investors in making informed choices.
Abnormal Return Explained
Abnormal return is most important, a measure which can help in gauging the performance of the portfolio manager and the correctness of his insights of market movement. This further gives asset management companies ground to base the performance-based bonuses or commissions of their portfolio managers and a justification of the same for client understanding.
Also, as it can be positive or negative, it can indicate when the divergence from the market index is not fruitful and should be narrowed, for the better performance of the portfolio.
When one wants to judge whether security or a group of securities have over or underperformed its peers, they need to figure out on what parameters to judge such performance. Therefore, the investment community has come up with such measures as the Abnormal return to articulate how much of such performance can be attributed to the skills of the portfolio manager and his scheme of asset allocation and stock selection.
When the performance of a portfolio is to be compared, a proportional market index is used as a benchmark over which we calculate the excess. For example, if one wants to compare a portfolio of financial sector stock in India, one may use the Nifty Bank Index, while if they have a portfolio of large-cap stocks in the US, then they can have the S&P 500 as the benchmark.
Abnormal returns, as the name suggest, indicate a change in returns to beyond an expected level. A positive resultant, when the difference between expected and actual returns are figured out, is positive, it indicates the returns are greater than the expected returns. On the contrary, if the resultant is negative, it reflects the returns are lower than expected figures.
Though it can be either profits or losses, the former being more appealing, this drastic variation might reflect some manipulation or fraud in dealing with the datasets. This could either be a voluntary or involuntary act. Hence, the inputs must be checked. A minor variation is always expected by the entities, but a huge variation leads to doubts.
Formula
The formula that helps in the accurate abnormal return calculation is mentioned as follows:

It is represented as below,
Abnormal Return Formula = Actual Return - Expected Return
How to Calculate?
Examples
Let us consider the following instances to understand the abnormal return definition better and also check how it works:
Example #1
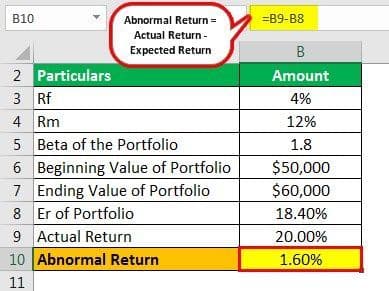
Suppose we are given the following information. Use this information to calculate abnormal return.
- Rf: 4%
- Rm: 12%
- Beta of the Portfolio: 1.8
- Beginning Value of Portfolio: $50,000
- Ending Value of Portfolio: $60,000
Solution:
Step 1: Calculation of Er of Portfolio
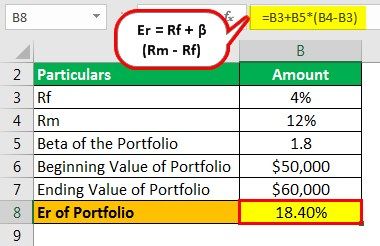
So we have calculated the expected return using the CAPM approach as follows:
Er = Rf + β (Rm - Rf)
Er = 4+1.8*(12% - 4%)
Er = 18.40%
The above calculation is done before the period under consideration starts, and it is only an estimation. When this period expires, we can calculate the actual return based on the market value at the beginning and the end of the period.
Step 2: Calculation of Actual Return can be done as follows,
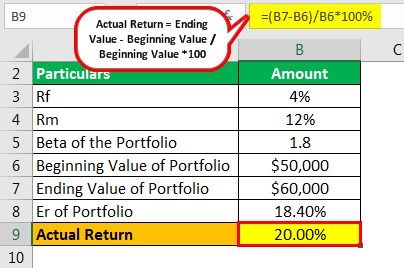
Actual Return = Ending Value - Beginning Value/Beginning Value*100
=$60000 - $50000/$50000 * 100
=20.00%
Step 3: Abnormal Return Calculation.
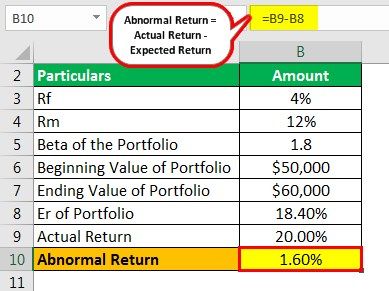
=20.00% - 18.40%
=1.60%
Example #2
In October 2022, a study was published that stated that the stocks purchases by senators lead to abnormal returns. The study revolved around the information asymmetry, which according to the researchers, was one of the reasons behind the market responding positively against the Senators’ purchase. The researchers selected a range of sample stocks purchased by the US Senate. The sample stocks were purchased between 2012 and 2020. The pattern suggested that the firms offering those stocks witnessed huge returns near the time it was disclosed.
Importance
Abnormal return is the unanticipated returns generated from the investments made. Such returns hold vital significance in the market as they help identify discrepancies. Let us have a look at the importance in a pointwise format:
- Performance Attribution Metric: It is directly affected by the stock selection of the portfolio manager. Therefore this measure is a key to judge her performance as compared to the appropriate benchmark and thereby it also helps in determining her performance-based compensation and skill-level.
- A check on Harmful Divergence: As mentioned earlier, Abnormal return can be negative if the actual return is lower than the expected return. Therefore, if this is for multiple periods, then it acts as an alarm for reducing the divergence from the benchmark index because it points out to a poor stock selection.
- Thorough Quantitative Analysis: As it can be calculated simply, it is a popular measure in the investment community, however, coming up with the correct estimates of the inputs of the CAPM model is not an easy task, as it involves the use of regression analysis to predict beta and a thorough observation of the past return numbers of the market index, therefore if done correctly, these estimates pass through a sieve of a thorough quantitative analysis and are therefore more likely to produce numbers with greater predictive power.
- Time Series Analysis: Using a measure called the CAR or the cumulative abnormal return helps analyze the effect of corporate actions such as dividend payout or stock split on the prices and return of the stock. It further helps analyze the effects of external events such as events on which certain corporate liabilities are contingent, for example, legal action or the settlement of a court case.
CAR is calculated by taking the sum of the abnormal returns over a specific p
