Table Of Contents
What Is An ABCD Pattern?
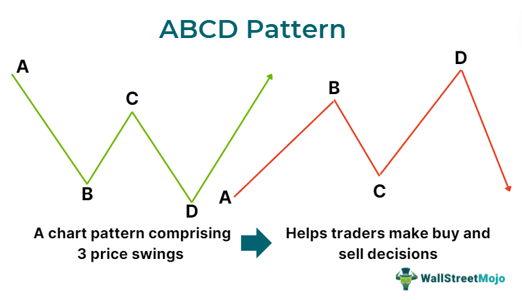
An ABCD chart pattern is a geometric pattern consisting of three price swings in a row with four distinct points — A, B, C, and D. This chart pattern signals a forthcoming trading opportunity. So, traders may utilize this tool to spot price movements and make financial gains.

The concept of Fibonacci ratios forms the basis of this harmonic chart pattern. Its formation takes place over a period and serves as a reflection of the rhythmic style often demonstrated by the price movements in the market. The harmonic pattern may follow bearish or bullish swings, indicating trend continuations or reversals.
Key Takeaways
- ABCD pattern refers to a chart pattern that demonstrates perfect harmony between time and price. Traders can use this pattern to spot trading opportunities and make trading decisions that can result in profits.
- One can easily identify it by observing the four points and three significant price swings.
- When engaging in ABCD pattern trading, one must ensure to place stop-loss orders to limit losses. Also, it is vital to track the progress closely after the execution of the trade and make adjustments when required.
- A key disadvantage of this pattern is that it is difficult to use for novice traders.
ABCD Pattern Explained
ABCD pattern refers to a price pattern in trading that comprises an initial leg down or leg up and then a short consolidation phase before another leg down or up in the initial or original move’s direction. This pattern gives key insights into the potential asset price targets and market sentiment.
If traders can observe and interpret the pattern efficiently, they can make decisions that can lead to significant financial gains. Note that there can be a bearish or bullish ABCD pattern across any condition, market, and timeframe.
The formation of this pattern involves four characteristics:
- It starts with a significant price movement from A to B, demonstrating an uptrend or downtrend.
- Then, a retracement or price reversal occurs from B to point C.
- The price moves toward the original direction
- Its formation is complete once the price moves to point D.
So, between points A, B, C, and D, this pattern forms three pattern legs, which are as follows:
- AB
- BC
- CD
Each of the above legs depicts three trends or price swings in a row, computed utilizing the Fibonacci ratio.
In the case of a bullish ABCD pattern, point A must be higher than point C, while point B must be higher than point D. On the other hand, In the case of its bearish counterpart, point C needs to be higher than A, while point B must be lower than point D.
For both bullish and bearish patterns, AB and CD are called legs, while BC is the retracement or correction.
Many traders use Saxo Bank International to research and invest in stocks across different markets. Its features like SAXO Stocks offer access to a wide range of global equities for investors.
How To Draw?
One can follow two steps to draw the ABCD pattern:
- Spot points A, B, C, and D on the asset's price chart. As mentioned earlier, A is the point at which the pattern’s formation starts, and D is the target price.
- Join points A and B and draw a line to D from C by using trendlines. AB represents the first significant price movement and BC is the correction, while D serves as the target price.
After drawing the pattern, one can measure the price distance between every point located on the chart earlier for spotting trading opportunities and visualizing price movements. Also, they can use Fibonacci retracement levels and tools for validating the pattern.
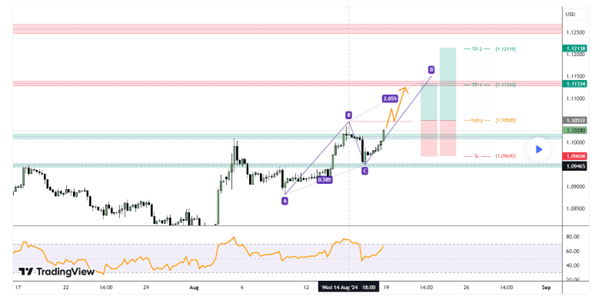
Let us look at the TradingView chart below to understand the process better.

In the above chart, we can observe the four points (A, B, C, and D) located on the price chart. Points A and B are joined using an upward trend line, while points B and C and C and D are joined using downward and upward trendlines, respectively. One can use Fibonacci retracement levels by selecting the relevant tool on the TradingView platform to validate the pattern.
When using the Fibonacci retracement tool on AB, BC must reach 0.618, and CD needs to be BC’s 1.272 Fibonacci extension.
How To Trade?
One can get a clear idea of ABCD pattern trading by looking at the pointers below:
- Spot the ABCD pattern on the price chart. A trader can look at different timeframes to identify the instances where the formation takes place.
- Confirm the validity of the pattern using Fibonacci levels and ensure that the criteria are met.
- Determine the entry point. Generally, it is close to point D, where one expects the price continuation or reversal to materialize.
- Placing take profit and stop loss orders is a vital part of risk management. The take profit orders help one in securing the gains at predetermined levels while the latter orders help in restricting potential losses.
- After executing the trade, track the progress carefully and adjust according to the changing market conditions whenever necessary.
Examples
Let us look at a few ABCD pattern examples to understand the concept better.
Example #1
Suppose Sam is a trader tracking XYZ stock. The security has been in a downtrend for a long time. He was observing the 1-day chart of the asset, and while doing so, he noticed the formation of a bullish ABCD pattern. After observing the pattern and validating it using Fibonacci ratios, he predicted that a trend reversal or uptrend is on the horizon. So, he decided to enter a long position. His strategy turned out to be prudent as the price rose significantly above point A, and an uptrend materialized.
Example #2
According to a report, On April 3, 2024, gold price reached a vital target of 2,298, and the stall on the next day (April 4) indicated that the market was cognizant of the price level. It completed a rising ABCD pattern’s CD leg, which is a reflection of the price symmetry with the pattern’s AB leg. The formation of the pattern began from last October’s swing low. As of April 4, the price increased by 27.4% or 494 points from that low.
Considering this pattern’s long-term nature, it was believed that the price of gold had reached a potential pivot level that could result in a retracement or correction and put an end to the significant advance, for the near term at least. However, it
For professional-grade stock and crypto charts, we recommend TradingView – one of the most trusted platforms among traders.
Disclosure: This article contains affiliate links. If you sign up through these links, we may earn a small commission at no extra cost to you.
Advantages And Disadvantages
Advantages
- Traders can utilize this tool in different market conditions to make the most of the available opportunities.
- It offers versatility as one can use it across different market scenarios and timeframes.
- It can help predict market reversals accurately by providing clear exit and entry points.
Disadvantages
- This pattern requires precise identification. Hence, it is not ideal for traders who are new to financial markets.
- Since market conditions are dynamic, the signals provided by this tool are not 100% accurate.
- The optimal effectiveness of this tool depends on complementary analysis.

